
本页内容
- 环境准备
- 添加 Grafana 软件源
- 安装 Grafana
- 配置 Grafana
- 安装 Nginx 反向代理
- 为 Prometheus 服务器添加身份验证
- 将 Prometheus 集成到 Grafana 仪表盘(添加 Prometheus 数据源、导入仪表盘监控)
- 添加 Prometheus 数据源
- 导入仪表盘监控
Grafana 是由 Grafana Labs 开发的开源、多平台数据可视化平台,提供包含图表、图形与告警功能的交互式数据可视化 Web 应用。借助 Grafana,你可以查询、可视化、设置告警,并探索时序数据库(TSDB)的指标、日志与链路追踪数据。它是一款强大的工具,能将时序数据库(TSDB)数据转化为富有洞察力的图形与可视化效果。
在 Grafana 中,你可以通过“数据源”(Data Source)添加时序数据库数据。Grafana 支持多种数据源,例如 Prometheus、InfluxDB、PostgreSQL、Loki、Jaeger、Graphite、Google Cloud Monitoring、AWS CloudWatch、Azure Monitor 等。
在本指南中,你将在 Debian 12 服务器上安装 Grafana,并以 Nginx 作为反向代理,随后添加 Prometheus 作为数据源,并配置 Grafana 仪表盘用于系统监控。
环境准备
在开始之前,请确保你满足以下条件:
- 用于安装 Grafana 的 Debian 12 服务器。
- 一台已安装 Prometheus 和 Node Exporter 的 Debian 12 服务器——可参考《如何在 Debian 12 上安装 Prometheus 和 Node Exporter》。
- 一个拥有 sudo 管理员权限的非 root 用户。
添加 Grafana 软件源
在本指南中,你将通过官方 Grafana 软件源安装 Grafana。为此,必须先将 Grafana 软件源添加到你的 Debian 服务器。
首先,运行以下命令为你的 Debian 系统安装基础依赖。
sudo apt install gnupg2 apt-transport-https software-properties-common wget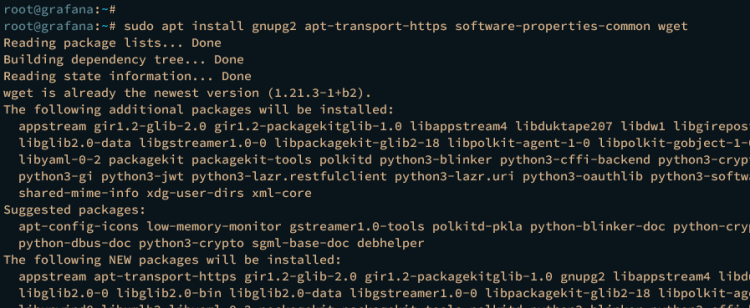
现在,执行以下命令添加 Grafana 的 GPG 密钥与软件源。
curl -fsSL https://packages.grafana.com/gpg.key | sudo gpg --dearmor -o /etc/apt/trusted.gpg.d/grafana.gpg
echo 'deb [signed-by=/etc/apt/trusted.gpg.d/grafana.gpg] https://packages.grafana.com/oss/deb stable main' | sudo tee /etc/apt/sources.list.d/grafana.list
最后,更新并刷新你的 Debian 软件包索引以应用更改。
sudo apt update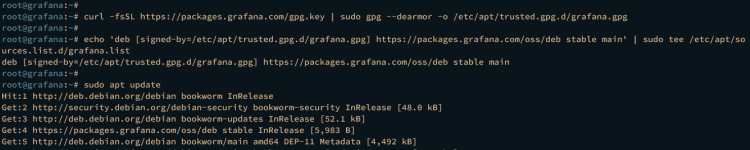
安装 Grafana
既然已经添加了 Grafana 软件源,接下来将通过 APT 安装 Grafana,随后配置该 Grafana 安装的管理员用户与密码。
使用以下命令在你的 Debian 系统上安装 Grafana。输入 y 以继续安装。
sudo apt install grafana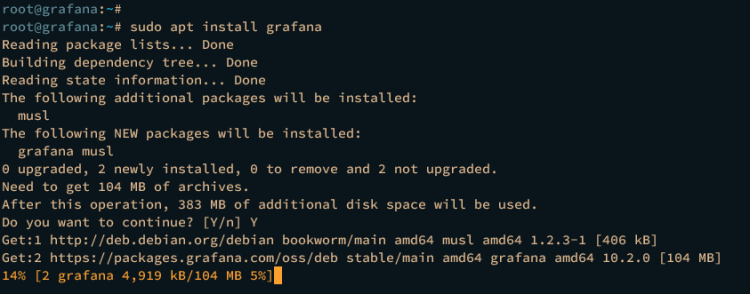
安装完成后,执行以下命令重新加载 systemd 管理器。
sudo systemctl daemon-reload然后,使用以下命令启动并启用 grafana-server 服务。
sudo systemctl start grafana-server
sudo systemctl enable grafana-server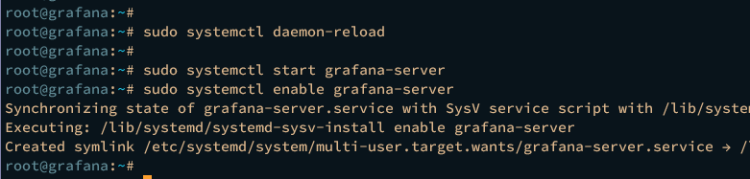
一旦 grafana-server 运行起来,使用以下命令进行验证。如果一切正常,你应该会看到 grafana-server 已启用并正在运行。
sudo systemctl status grafana-server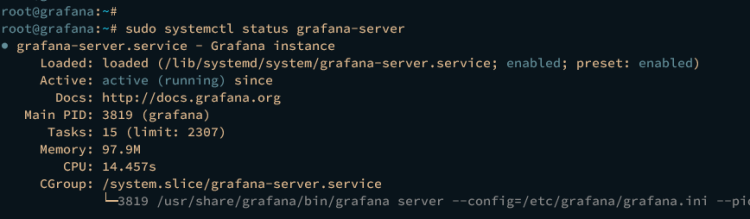
最后,打开你的 Web 浏览器,访问服务器的 IP 地址并带上 Grafana 默认端口 3000,例如 http://192.168.5.20:3000/ 。
输入默认用户名 admin 与密码 admin,然后点击 Login(登录)。

现在将默认的 admin 密码修改为一个新密码,然后点击 Submit(提交)确认。

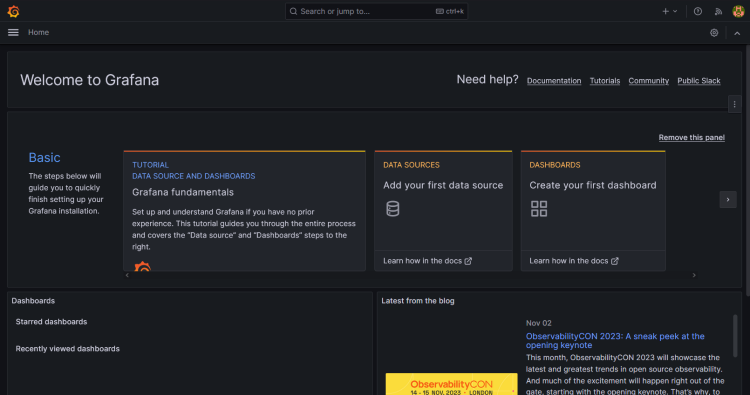
流程完成后,你应该会看到类似下图的 Grafana 仪表盘:
配置 Grafana
Grafana 安装完成后,下一步是通过修改默认配置文件 /etc/grafana/grafana.ini 来配置 Grafana,将 http_addr 设为 localhost,http_port 设为 3000,并将 domain 设置为本地域名 grafana.howtoforge.local。
使用以下 nano 编辑器命令打开默认的 Grafana 配置文件 /etc/grafana/grafana.ini。
sudo nano /etc/grafana/grafana.ini将默认配置修改为以下几行。在此示例中,你将让 Grafana 运行在 localhost 上,并使用本地域名 grafana.howtoforge.local。
[server]
# The IP address to bind to, empty will bind to all interfaces
http_addr = localhost
# The http port  to use
http_port = 3000
# The public facing domain name used to access grafana from a browser
domain = grafana.howtoforge.local
完成后,保存并退出文件。
现在运行以下 systemctl 命令重启 grafana-server 以使更改生效。这样,你的 Grafana 安装就只会运行在 localhost 上。
sudo systemctl restart grafana-server安装 Nginx 作为反向代理
在本指南中,你将让 Grafana 以 Nginx 作为反向代理运行。现在,请完成以下操作,为你的 Grafana 安装部署并配置 Nginx 反向代理。
运行以下命令为你的 Debian 系统安装 Nginx Web 服务器。输入 y 以继续安装。
sudo apt install nginx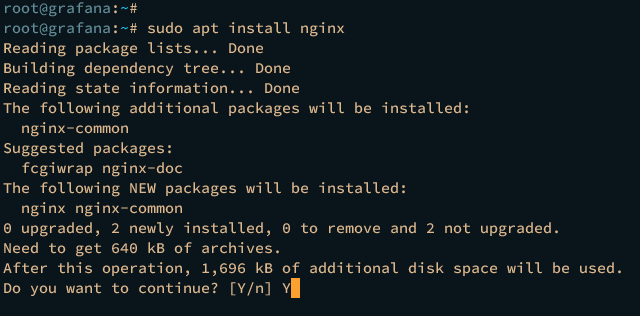
Nginx 安装完成后,运行以下 nano 编辑器命令创建新的 server block 配置文件 /etc/nginx/sites-available/grafana.conf。
sudo nano /etc/nginx/sites-available/grafana.conf插入以下配置,并务必将 server_name 参数中的域名改为你自己的域名。
# This is required to proxy Grafana Live WebSocket connections.
map $http_upgrade $connection_upgrade {
    default upgrade;
    '' close;
}
server {
    listen      80;
    server_name grafana.howtoforge.local;
    root /usr/share/nginx/html;
    index index.html index.htm;
    access_log /var/log/nginx/grafana-access.log;
    error_log /var/log/nginx/grafana-error.log;
    location / {
        proxy_set_header Host $http_host;
        proxy_pass http://localhost:3000/;
    }
    # Proxy Grafana Live WebSocket connections.
    location /api/live {
        rewrite  ^/(.*)  /$1 break;
        proxy_http_version 1.1;
        proxy_set_header Upgrade $http_upgrade;
        proxy_set_header Connection $connection_upgrade;
        proxy_set_header Host $http_host;
        proxy_pass http://localhost:3000/;
    }
}
完成后保存并关闭文件。
接下来,运行以下命令启用配置文件 /etc/nginx/sites-available/grafana.conf,并验证 Nginx 语法以确保配置正确。
sudo ln -s /etc/nginx/sites-available/grafana.conf /etc/nginx/sites-enabled/
sudo nginx -t
如果 Nginx 语法正确,你会看到输出“test is successful - syntax is ok”(测试成功,语法正常)。
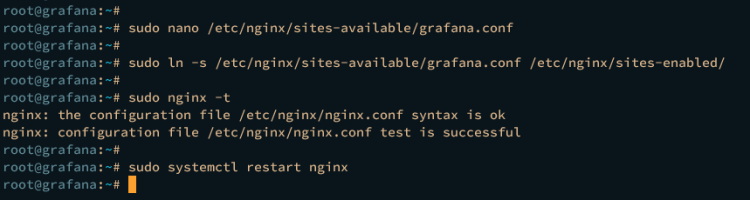
最后,运行以下 systemctl 命令重启 Nginx 服务以应用更改,然后验证 Nginx 确保服务正在运行。
sudo systemctl restart nginx
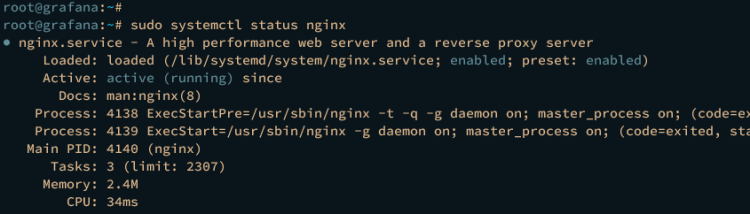
sudo systemctl status nginx
在以下输出中,你应该会看到 Nginx 服务正在运行。
要访问你的 Grafana 服务器,如果你是 Linux 或 MacOS 用户,可以修改本机的 /etc/hosts 文件;Windows 用户则需以管理员身份编辑 C:\Windows\System32\drivers\etc\hosts 文件。
在文件中添加如下配置。
192.168.5.15 grafana.howtoforge.local
完成后保存并关闭文件。
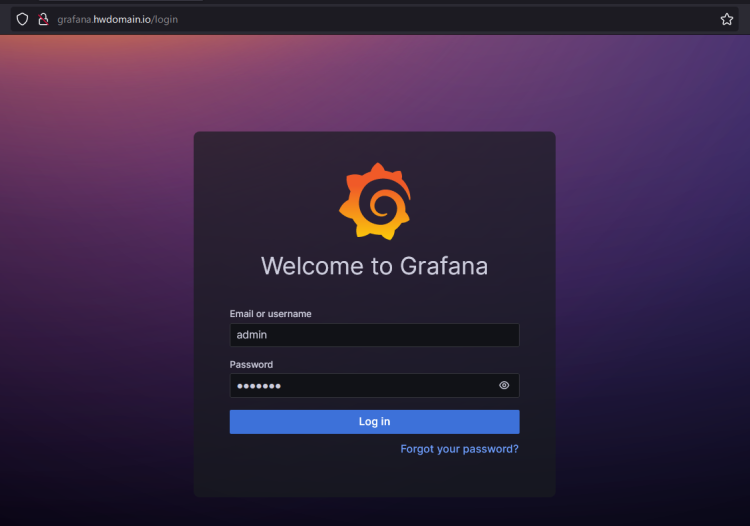
现在回到 Web 浏览器,访问 Grafana 服务器的本地域名,例如 http://grafana.howtoforge.local/ 。如果配置成功,你将被重定向到 Grafana 登录页面。
使用你的 admin 用户和密码登录,然后点击 Login(登录)确认。
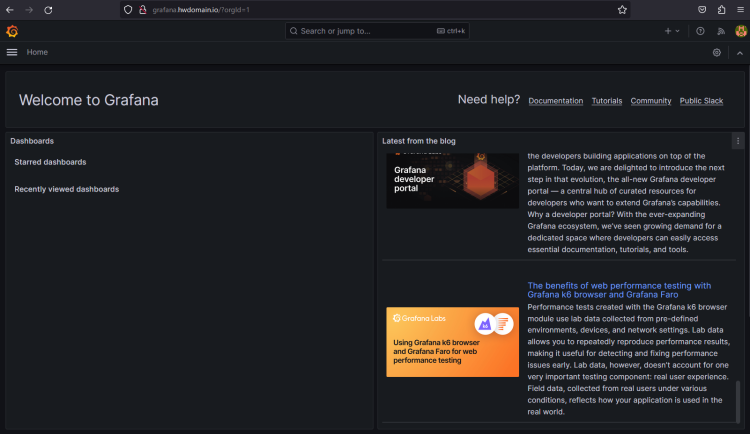
现在你应该会看到 Grafana 管理员仪表盘。
为 Prometheus 服务器添加身份验证
在将 Prometheus 添加到 Grafana 之前,你需要为 Prometheus 配置基础身份验证(basic authentication)。你将使用 apache2-utils 生成基础身份验证密码,然后为 Prometheus 服务器启用 basic_auth。
在本示例中,Prometheus 与 Node Exporter 安装在不同的服务器上,其 IP 地址为 192.168.5.15,主机名为 prometheus。
登录到 Prometheus 服务器,并通过以下 apt 命令安装 apache2-utils 软件包。
sudo apt install apache2-utils -y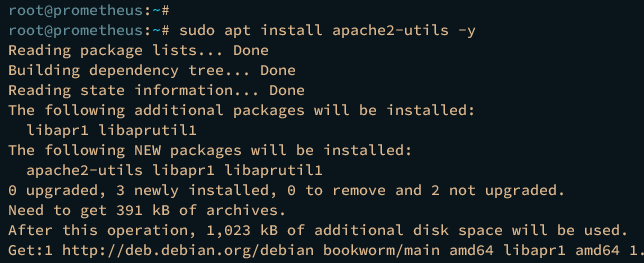
随后,为 Prometheus 基础身份验证生成新密码。输入你的密码,并将生成的密码复制到记事本中保存。
htpasswd -nB promadmin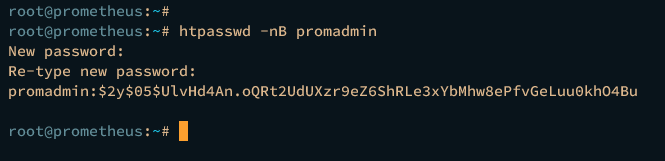
现在,使用以下 nano 编辑器命令创建新的 Prometheus 配置文件 /etc/prometheus/web.yml。
sudo nano /etc/prometheus/web.yml添加以下配置,通过 basic_auth 模块来保护 Prometheus 管理仪表盘。
# basic_auth
basic_auth_users:
  promadmin: $2y$05$UlvHd4An.oQRt2UdUXzr9eZ6ShRLe3xYbMhw8ePfvGeLuu0khO4Bu
完成后保存并关闭文件。
接下来,使用以下 nano 编辑器命令打开默认的 Prometheus 配置文件 /etc/prometheus/prometheus.yml。
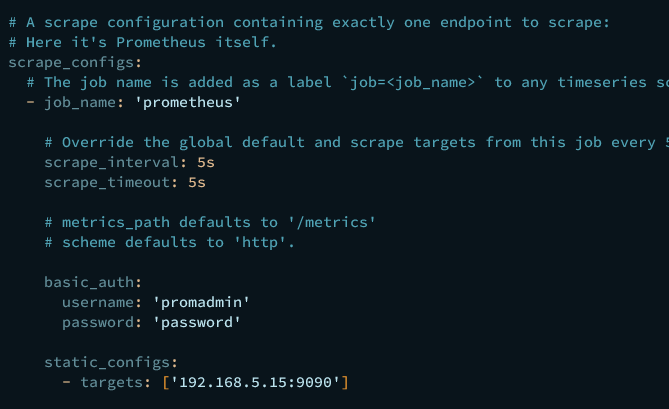
sudo nano /etc/prometheus/prometheus.yml在 Prometheus job 中添加如下 basic_auth 配置,并务必将用户名与密码替换为你自己的数据。
scrape_configs:
  # The job name is added as a label `job=<job_name>` to any timeseries scraped from this config.
  - job_name: "prometheus"
    # metrics_path defaults to '/metrics'
    # scheme defaults to 'http'.
    # Add settings for certificate and authentication
    scheme: http
    basic_auth:
      username: 'promadmin'
      password: 'password'
完成后保存并关闭文件。
接下来,运行以下命令编辑 prometheus 服务文件。
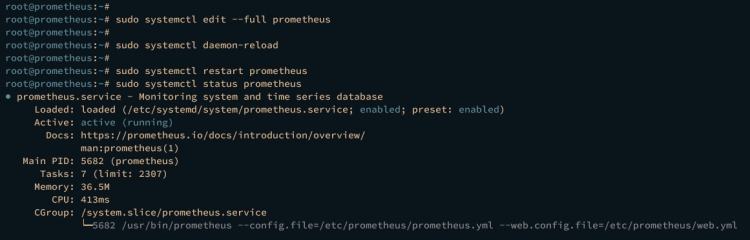
sudo systemctl edit --full prometheus将默认的 ExecStart 选项修改为以下内容。
ExecStart=/usr/bin/prometheus --config.file=/etc/prometheus/prometheus.yml --web.config.file=/etc/prometheus/web.yml
完成后保存并关闭文件。

现在运行以下 systemctl 命令重新加载 systemd 管理器以应用更改,然后重启 prometheus 服务。
sudo systemctl daemon-reload
sudo systemctl restart prometheus
使用以下命令验证 prometheus 服务。
sudo systemctl status prometheus在 ExecStart 部分,命令已更改为如下内容。
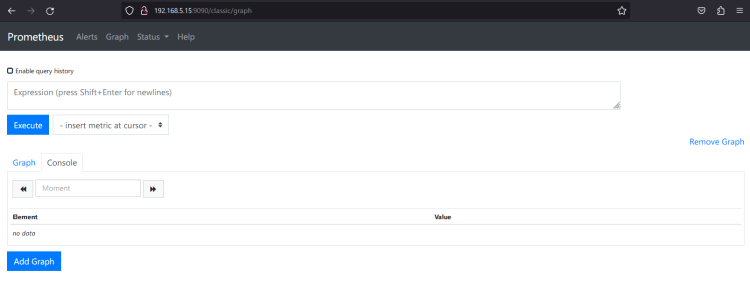
最后,打开你的 Web 浏览器,访问 Prometheus 的 IP 地址并带上端口 9090(即 http://192.168.10.15:9090/ )。系统会弹出 Prometheus 基础身份验证提示,输入你的 admin 用户名与密码,然后点击 Sign In(登录)。
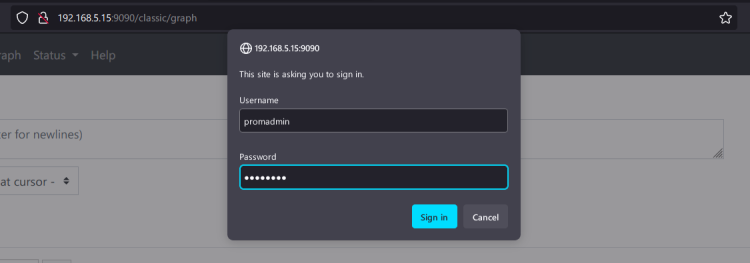
如果配置成功,你应该会看到类似下图的 Prometheus 仪表盘。
将 Prometheus 集成到 Grafana 仪表盘
在 Prometheus 上配置完基础身份验证后,你就可以将 Prometheus 作为数据源添加到 Grafana 仪表盘。你需要完成两个步骤:将 Prometheus 添加为数据源,然后为系统监控导入或创建 Grafana 仪表盘。
添加 Prometheus 数据源
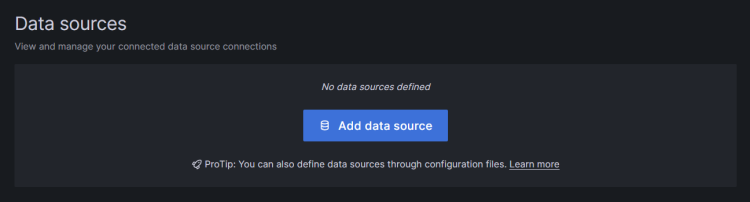
回到 Grafana 仪表盘,点击 Connections(连接)菜单,然后选择 Data source(数据源)。

点击 Add data source(添加数据源)继续。
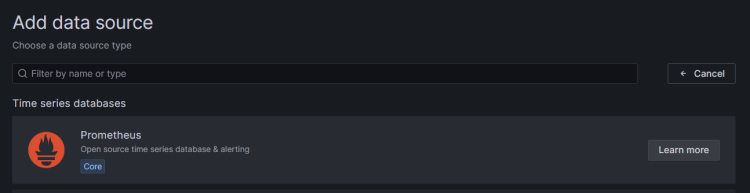
选择时序数据库 Prometheus。
输入新数据源的名称,并将 Prometheus 主机设置为 http://192.168.5.15:9090/。在 Authentication(身份验证)部分,选择 Basic Authentication(基础身份验证),并输入 Prometheus 的用户名与密码。
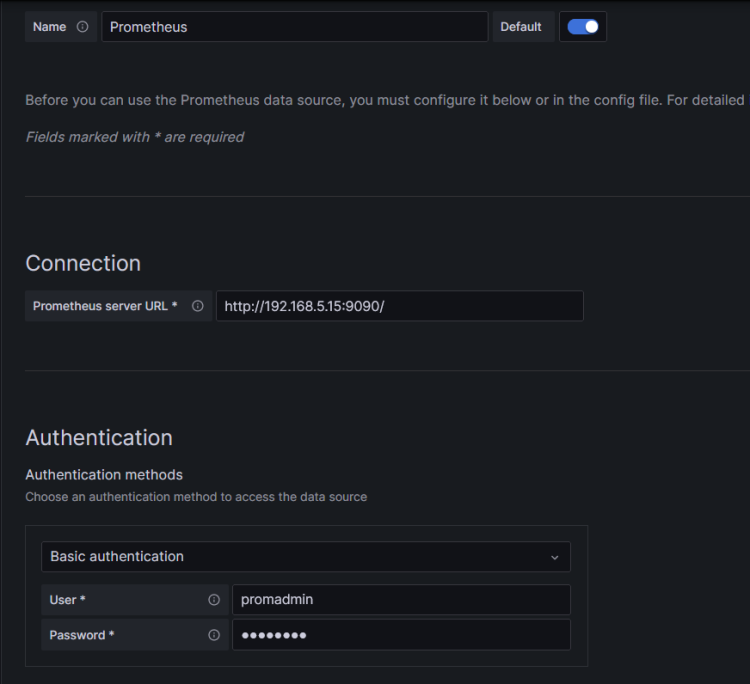
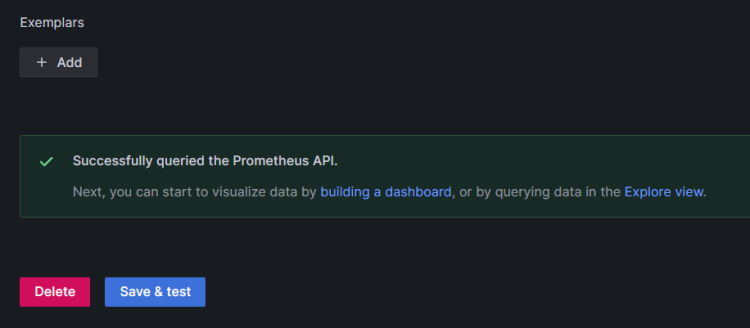
向下滚动并点击 Save & test(保存并测试)确认。出现“Successfully queried the Prometheus API.”(成功查询 Prometheus API)的输出即表明 Prometheus 已成功添加到 Grafana。
导入仪表盘监控
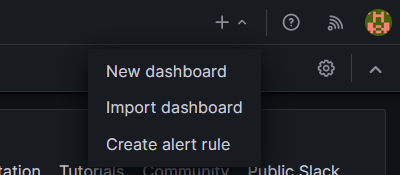
点击右上角的 + 菜单,选择 Import Dashboard(导入仪表盘)。
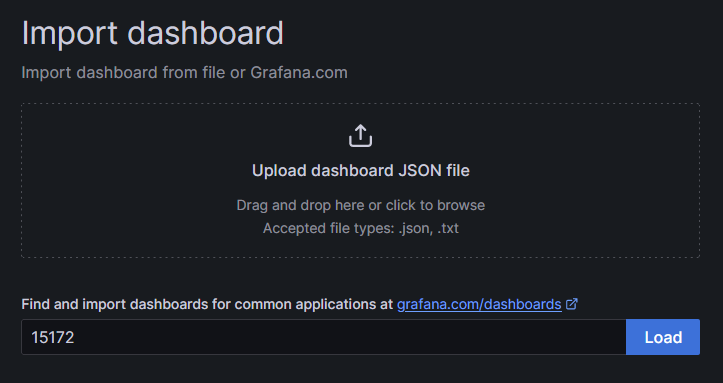
在 https://grafana.com/grafana/dashboards/ 找到你心仪的仪表盘,然后复制并粘贴其仪表盘 ID,点击 Load(加载)确认。本示例将使用仪表盘 ID 15172。
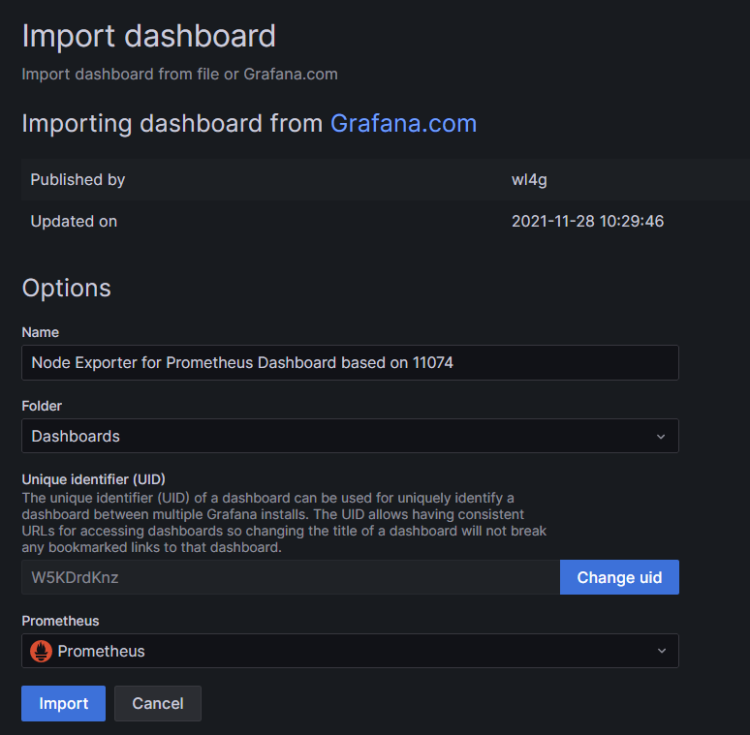
输入仪表盘名称并选择 Prometheus 数据源,然后点击 Import(导入)确认。
以下是通过 Prometheus 监控系统的改进版 Grafana 仪表盘示例。
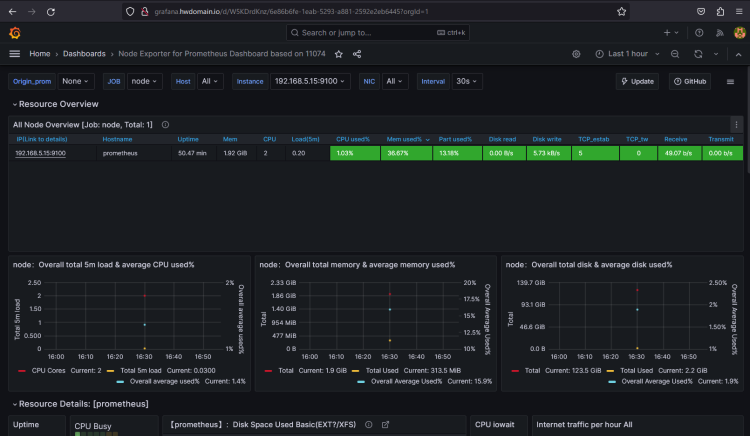
至此,你已成功在 Debian 12 服务器上安装了 Grafana(以 Nginx 作为反向代理),将 Prometheus 添加为 Grafana 的数据源,并导入了用于系统监控的 Grafana 仪表盘。