
本教程适用于以下操作系统版本
- Rocky Linux 9
- Rocky Linux 8.4
本页目录
- 准备工作
- 第一部分
- 步骤 1 - 安装 Suricata
- 步骤 2 - 配置 Suricata(启用 Community ID、选择网络接口、实时规则重载、配置目录权限、将当前用户加入 Suricata 组)
- 步骤 3 - 配置 Suricata 规则(添加规则集提供方)
- 步骤 4 - 验证 Suricata 配置
- 步骤 5 - 运行 Suricata
- 步骤 6 - 测试 Suricata 规则
- 第二部分
- 步骤 7 - 安装 Elasticsearch 和 Kibana
- 步骤 8 - 配置 Elasticsearch(配置 JVM 堆大小、配置防火墙、启动 Elasticsearch、创建密码)
- 步骤 9 - 配置 Kibana(配置主机、关闭遥测、配置 SSL、配置访问、启动 Kibana)
- 步骤 10 - 访问 Kibana 仪表盘(使用 SSH 本地隧道、使用 Nginx 反向代理、安装 Nginx、配置防火墙、安装并配置 SSL、配置 Nginx、配置 SELinux 以启用 Nginx、完成 Kibana 与 Elasticsearch 的配置)
- 步骤 11 - 安装并配置 Filebeat
- 步骤 12 - 管理 Kibana 仪表盘
- 总结
- 启用 Community ID
- 选择网络接口
- 实时规则重载
- 配置目录权限
- 将当前用户加入 Suricata 组
- 添加规则集提供方
- 配置 JVM 堆大小
- 配置防火墙
- 启动 Elasticsearch
- 创建 Elasticsearch 密码
- 配置 Kibana 主机
- 关闭遥测
- 配置 SSL
- 配置 Kibana 访问
- 启动 Kibana
- 使用 SSH 本地隧道
- 使用 Nginx 反向代理
- 安装 Nginx
- 配置防火墙
- 安装并配置 SSL
- 配置 Nginx
- 配置 SELinux 以启用 Nginx
- 完成 Kibana 与 Elasticsearch 的配置
Suricata 是一款网络监控工具,它会检查并处理流经服务器的每一个网络数据包。检测到任何可疑活动时,它可以生成日志事件、触发警报并丢弃相关流量。
你可以在单台机器上安装 Suricata 以监控其自身流量,也可以将其部署在网关主机上,扫描连接到该主机的其他服务器的所有进出流量。你可以将 Suricata 与 Elasticsearch、Kibana 和 Filebeat 结合使用,构建一套安全信息和事件管理(SIEM)工具。
在本教程中,你将在 Rocky Linux 9 服务器上安装 Suricata IDS 和 Elastic Stack。该技术栈的各个组件如下:
- Elasticsearch:用于存储、索引、关联和检索来自服务器的安全事件。
- Kibana:用于展示存储在 Elasticsearch 中的日志。
- Filebeat:用于解析 Suricata 的 eve.json 日志文件,并将每个事件发送到 Elasticsearch 进行处理。
- Suricata:扫描网络流量中的可疑事件,并丢弃无效数据包。
本教程分为两部分:第一部分讲解 Suricata 的安装与配置,第二部分讲解 Elastic Stack 的安装与配置。
在本教程中,我们将把 Suricata 和 Elastic Stack 安装在不同的服务器上。
准备工作
- 承载 Elastic Stack 和 Suricata 的服务器至少应具备 4GB 内存和 2 个 CPU 核心。
- 服务器之间应能通过私有 IP 地址相互通信。
- 服务器应运行 Rocky Linux 9,并拥有一个具备 sudo 权限的非 root 用户。
- 服务器应已更新系统。$ sudo dnf update
- 如果你希望从任何地方访问 Kibana 仪表盘,请配置一个指向 Suricata 所在服务器的域名(kibana.example.com)。
- 在两台服务器上都安装必要软件包。$ sudo dnf install yum-utils nano curl wget policycoreutils-python-utils -y
承载 Elastic Stack 和 Suricata 的服务器至少应具备 4GB 内存和 2 个 CPU 核心。
服务器之间应能通过私有 IP 地址相互通信。
服务器应运行 Rocky Linux 9,并拥有一个具备 sudo 权限的非 root 用户。
服务器应当已更新系统。
$ sudo dnf update
如果你希望从任何地方访问 Kibana 仪表盘,请配置一个指向 Suricata 所在服务器的域名(kibana.example.com)。
在两台服务器上都安装必要的软件包。
$ sudo dnf install yum-utils nano curl wget policycoreutils-python-utils -y
第一部分
步骤 1 - 安装 Suricata
要安装 Suricata,你需要将开放信息安全基金会(OISF)的软件包仓库添加到服务器上。
$ sudo dnf install 'dnf-command(copr)'
$ sudo dnf copr enable @oisf/suricata-7.0
第一条命令为 dnf 包管理器启用社区项目(copr)。第二条命令将 OISF 仓库添加到你的系统。suricata-7.0 启用该仓库以访问软件的最新稳定版本。每当系统提示时,按 y 并回车确认。
接下来,添加 EPEL 仓库。
$ sudo dnf install -y epel-release dnf-plugins-core
安装 Suricata。
$ sudo dnf install -y suricata
启用 Suricata 服务。
$ sudo systemctl enable suricata
步骤 2 - 配置 Suricata
Suricata 的配置文件位于 /etc/suricata/suricata.yaml。Suricata 的默认模式是 IDS(入侵检测系统)模式,仅记录流量而不进行拦截。如果你是 Suricata 新手,建议保持该模式不变。待你完成配置并了解更多之后,再开启 IPS(入侵防御系统)模式。
启用 Community ID
Community ID 字段能够更轻松地在由不同监控工具生成的记录之间关联数据。由于我们会将 Suricata 与 Elasticsearch 配合使用,启用 Community ID 会很有帮助。
打开 /etc/suricata/suricata.yaml 文件进行编辑。
$ sudo nano /etc/suricata/suricata.yaml
找到 # Community Flow ID 这一行,将变量 community-id 的值设为 true。
. . .
      # Community Flow ID
      # Adds a 'community_id' field to EVE records. These are meant to give
      # records a predictable flow ID that can be used to match records to
      # output of other tools such as Zeek (Bro).
      #
      # Takes a 'seed' that needs to be same across sensors and tools
      # to make the id less predictable.

      # enable/disable the community id feature.
      community-id: true
. . .
按 Ctrl + X 保存文件,并在提示时输入 Y 确认。
现在,你的事件将携带一个形如 1:S+3BA2UmrHK0Pk+u3XH78GAFTtQ= 的 ID,你可以用它在不同的监控工具之间匹配数据集。
选择网络接口
Suricata 的默认配置文件会检查 eth0 设备(网络接口)上的流量。如果你的服务器使用不同的网络接口,则需要在配置中相应更新。
使用以下命令查看你的网络接口设备名称。
$ ip -p -j route show default
你将获得类似以下的输出。
[ {
        "dst": "default",
        "gateway": "172.31.1.1",
        "dev": "eth0",
        "protocol": "dhcp",
        "prefsrc": "65.108.61.177",
        "metric": 100,
        "flags": [ ]
    } ]
dev 变量指的是网络设备的名称。在我们的输出中,网络设备为 eth0。根据你的系统不同,你的输出可能会有所不同。
现在你已经知道了设备名称,打开配置文件。
$ sudo nano /etc/suricata/suricata.yaml
找到第 580 行附近的 af-packet: 行。在其下方,将变量 interface 的值设为你的系统的设备名称。
# Linux high speed capture support
af-packet:
  - interface: eth0
    # Number of receive threads. "auto" uses the number of cores
    #threads: auto
    # Default clusterid. AF_PACKET will load balance packets based on flow.
    cluster-id: 99
. . .
如果你想添加额外的接口,可以在第 650 行附近的 af-packet 部分底部添加。
要添加新接口,请将其插入到 - interface: default 部分的上方,如下所示。
    #  For eBPF and XDP setup including bypass, filter and load balancing, please
    #  see doc/userguide/capture-hardware/ebpf-xdp.rst for more info.

  - interface: enp0s1
    cluster-id: 98
...
  - interface: default
    #threads: auto
    #use-mmap: no
    #tpacket-v3: yes
在我们的示例中,我们添加了一个新接口 enp0s1 以及一个唯一的 cluster-id 变量值。你每添加一个接口,都需要为其指定一个唯一的 cluster id。
找到 pcap: 行,在其下方将变量 interface 的值设为你的系统的设备名称。
# Cross platform libpcap capture support
pcap:
  - interface: eth0
    # On Linux, pcap will try to use mmap'ed capture and will use "buffer-size"
    # as total memory used by the ring. So set this to something bigger
    # than 1% of your bandwidth.
与之前类似,要添加新接口,请将其插入到 - interface: default 部分的上方,如下所示。
- interface: enp0s1
# Put default values here
  - interface: default
    #checksum-checks: auto
完成后,按 Ctrl + X 保存文件,并在提示时输入 Y 确认。
实时规则重载
过去每次添加、删除或编辑规则时都需要重启 Suricata。不过现在无需任何额外操作即可启用该功能,因为它是默认开启的。
启用实时重载后,你可以使用以下命令在不重启 Suricata 进程的情况下重新加载规则。
$ sudo kill -usr2 $(pidof suricata)
$(pidof suricata) 部分用于定位 Suricata 进程的 ID。kill 命令中的 -USR2 部分向 Suricata 进程发送 SIGUSR2 信号。Suricata 已将该 SIGUSR2 信号配置为重新加载规则。
配置目录权限
Suricata 在安装过程中会自动创建一个名为 suricata 的系统用户和组。你需要为相关目录设置正确的权限,以确保其正常运行。
运行以下命令,将 suricata 设为 Suricata 各目录的所属组。
$ sudo chgrp -R suricata /etc/suricata
$ sudo chgrp -R suricata /var/lib/suricata
$ sudo chgrp -R suricata /var/log/suricata
设置组的读写权限。
$ sudo chmod -R g+r /etc/suricata/
$ sudo chmod -R g+rw /var/lib/suricata
$ sudo chmod -R g+rw /var/log/suricata
将当前用户加入 Suricata 组
Suricata 在安装过程中会自动创建一个名为 suricata 的系统用户和组。将你当前的用户名加入 suricata 组,这样你就可以直接执行操作而无需使用 sudo。
$ sudo usermod -a -G suricata $USER
要使新的组身份生效,请退出服务器后重新登录,或执行以下命令:
$ su - ${USER}
系统会提示你输入当前用户的密码以继续。
输入以下命令,确认你的用户已加入 suricata 组:
$ id -nG
username wheel suricata
步骤 3 - 配置 Suricata 规则
默认情况下,Suricata 仅使用有限的规则集来检测网络流量。你可以使用名为 suricata-update 的工具,从外部提供方添加更多规则集。运行以下命令以包含额外规则。
$ suricata-update
14/4/2024 -- 01:32:58 - <Info> -- Using data-directory /var/lib/suricata.
14/4/2024 -- 01:32:58 - <Info> -- Using Suricata configuration /etc/suricata/suricata.yaml
14/4/2024 -- 01:32:58 - <Info> -- Using /usr/share/suricata/rules for Suricata provided rules.
14/4/2024 -- 01:32:58 - <Info> -- Found Suricata version 7.0.4 at /usr/sbin/suricata.
.....
14/4/2024 -- 01:32:58 - <Info> -- No sources configured, will use Emerging Threats Open
14/4/2024 -- 01:32:58 - <Info> -- Fetching https://rules.emergingthreats.net/open/suricata-7.0.4/emerging.rules.tar.gz.
 100% - 4243799/4243799
14/4/2024 -- 01:33:00 - <Info> -- Done.
14/4/2024 -- 01:33:00 - <Info> -- Loading distribution rule file /usr/share/suricata/rules/app-layer-events.rules
.....
14/4/2024 -- 01:33:04 - <Info> -- Writing rules to /var/lib/suricata/rules/suricata.rules: total: 48646; enabled: 37144; added: 48646; removed 0; modified: 0
14/4/2024 -- 01:33:04 - <Info> -- Writing /var/lib/suricata/rules/classification.config
14/4/2024 -- 01:33:04 - <Info> -- Testing with suricata -T.
14/4/2024 -- 01:33:41 - <Info> -- Done.
添加规则集提供方
你可以通过添加更多提供方来扩展 Suricata 的规则。它可以从各种免费和商业提供方获取规则。
你可以使用以下命令列出默认的提供方列表。
$ suricata-update list-sources
例如,如果你想包含 tgreen/hunting 规则集,可以使用以下命令启用它。
$ suricata-update enable-source tgreen/hunting
14/4/2024 -- 01:37:07 - <Info> -- Using data-directory /var/lib/suricata.
14/4/2024 -- 01:37:07 - <Info> -- Using Suricata configuration /etc/suricata/suricata.yaml
14/4/2024 -- 01:37:07 - <Info> -- Using /usr/share/suricata/rules for Suricata provided rules.
14/4/2024 -- 01:37:07 - <Info> -- Found Suricata version 7.0.4 at /usr/sbin/suricata.
14/4/2024 -- 01:37:07 - <Warning> -- Source index does not exist, will use bundled one.
14/4/2024 -- 01:37:07 - <Warning> -- Please run suricata-update update-sources.
14/4/2024 -- 01:37:07 - <Info> -- Creating directory /var/lib/suricata/update/sources
14/4/2024 -- 01:37:07 - <Info> -- Enabling default source et/open
14/4/2024 -- 01:37:07 - <Info> -- Source tgreen/hunting enabled
再次运行 suricata-update 命令,以下载并更新新规则。默认情况下,Suricata 可以在不重启的情况下处理任何规则变更。
步骤 4 - 验证 Suricata 配置
Suricata 自带一个验证工具,用于检查配置文件和规则中的错误。运行以下命令以启动验证工具。
$ suricata -T -c /etc/suricata/suricata.yaml -v
Notice: suricata: This is Suricata version 7.0.4 RELEASE running in SYSTEM mode
Info: cpu: CPUs/cores online: 2
Info: suricata: Running suricata under test mode
Info: suricata: Setting engine mode to IDS mode by default
Info: exception-policy: master exception-policy set to: auto
Info: logopenfile: fast output device (regular) initialized: fast.log
Info: logopenfile: eve-log output device (regular) initialized: eve.json
Info: logopenfile: stats output device (regular) initialized: stats.log
Info: detect: 1 rule files processed. 37144 rules successfully loaded, 0 rules failed, 0
Info: threshold-config: Threshold config parsed: 0 rule(s) found
Info: detect: 37147 signatures processed. 1194 are IP-only rules, 4892 are inspecting packet payload, 30849 inspect application layer, 108 are decoder event only
Notice: suricata: Configuration provided was successfully loaded. Exiting.
-T 参数指示 Suricata 以测试模式运行,-c 参数指定配置文件的位置,-v 参数则打印命令的详细输出。根据你系统的配置以及所添加规则的数量,该命令可能需要几分钟才能完成。
步骤 5 - 运行 Suricata
Suricata 现已配置完成,是时候运行该应用程序了。
$ sudo systemctl start suricata
检查进程的状态。
$ sudo systemctl status suricata
如果一切正常,你应该看到以下输出。
? suricata.service - Suricata Intrusion Detection Service
     Loaded: loaded (/usr/lib/systemd/system/suricata.service; enabled; preset: disabled)
     Active: active (running) since Sun 2024-04-14 01:45:43 UTC; 4s ago
       Docs: man:suricata(1)
    Process: 6081 ExecStartPre=/bin/rm -f /var/run/suricata.pid (code=exited, status=0/SUCCESS)
   Main PID: 6082 (Suricata-Main)
      Tasks: 1 (limit: 22569)
     Memory: 111.8M
        CPU: 4.318s
     CGroup: /system.slice/suricata.service
             ??6082 /sbin/suricata -c /etc/suricata/suricata.yaml --pidfile /var/run/suricata.pid -i eth0 --user suricata

Apr 14 01:45:43 suricata systemd[1]: Starting Suricata Intrusion Detection Service...
Apr 14 01:45:43 suricata systemd[1]: Started Suricata Intrusion Detection Service.
Apr 14 01:45:43 suricata suricata[6082]: i: suricata: This is Suricata version 7.0.4 RELEASE running in SYSTEM mode
你可能会在服务状态中看到以下错误。
Apr 15 02:20:13 suricata suricata[5554]: E: logopenfile: Error opening file: "/var/log/suricata//fast.log": Permission denied
Apr 15 02:20:13 suricata suricata[5554]: W: runmodes: output module "fast": setup failed
Apr 15 02:20:13 suricata suricata[5554]: E: logopenfile: Error opening file: "/var/log/suricata//eve.json": Permission denied
Apr 15 02:20:13 suricata suricata[5554]: W: runmodes: output module "eve-log": setup failed
Apr 15 02:20:13 suricata suricata[5554]: E: logopenfile: Error opening file: "/var/log/suricata//stats.log": Permission denied
Apr 15 02:20:13 suricata suricata[5554]: W: runmodes: output module "stats": setup failed
你需要重新设置相关权限。
$ sudo chown -R suricata:suricata /var/log/suricata
重启 Suricata 服务。
$ sudo systemctl restart suricata
该进程可能需要几分钟才能解析完所有规则。因此,上述状态检查并不能完全说明 Suricata 是否已启动就绪。你可以使用以下命令监控日志文件来确认。
$ sudo tail -f /var/log/suricata/suricata.log
如果你看到以下行,说明 Suricata 正在运行并已准备好监控网络流量。
[5577 - Suricata-Main] 2024-04-15 02:22:52 Info: exception-policy: master exception-policy set to: auto
[5577 - Suricata-Main] 2024-04-15 02:22:52 Info: ioctl: eth0: MTU 1500
[5577 - Suricata-Main] 2024-04-15 02:22:52 Info: privs: dropped the caps for main thread
[5577 - Suricata-Main] 2024-04-15 02:22:52 Info: conf: Running in live mode, activating unix socket
[5577 - Suricata-Main] 2024-04-15 02:22:52 Info: logopenfile: fast output device (regular) initialized: fast.log
[5577 - Suricata-Main] 2024-04-15 02:22:52 Info: logopenfile: eve-log output device (regular) initialized: eve.json
[5577 - Suricata-Main] 2024-04-15 02:22:52 Info: logopenfile: stats output device (regular) initialized: stats.log
[5577 - Suricata-Main] 2024-04-15 02:23:03 Info: detect: 1 rule files processed. 37144 rules successfully loaded, 0 rules failed, 0
[5577 - Suricata-Main] 2024-04-15 02:23:03 Info: threshold-config: Threshold config parsed: 0 rule(s) found
[5577 - Suricata-Main] 2024-04-15 02:23:04 Info: detect: 37147 signatures processed. 1194 are IP-only rules, 4892 are inspecting packet payload, 30849 inspect application layer, 108 are decoder event only
[5577 - Suricata-Main] 2024-04-15 02:23:32 Info: runmodes: eth0: creating 2 threads
[5577 - Suricata-Main] 2024-04-15 02:23:32 Info: unix-manager: unix socket '/var/run/suricata/suricata-command.socket'
[5577 - Suricata-Main] 2024-04-15 02:23:32 Notice: threads: Threads created -> W: 2 FM: 1 FR: 1   Engine started.
按 Ctrl + C 退出输出查看。
步骤 6 - 测试 Suricata 规则
我们将检查 Suricata 是否检测到了可疑流量。Suricata 指南建议使用以下命令测试 ET Open 规则(编号 2100498)。
$ curl http://testmynids.org/uid/index.html
你将获得以下响应。
uid=0(root) gid=0(root) groups=0(root)
上述命令会模拟返回一个在被入侵系统上运行 id 命令的输出。要测试 Suricata 是否检测到了该流量,你需要使用指定的规则编号来检查日志文件。
$ grep 2100498 /var/log/suricata/fast.log
如果你的请求使用的是 IPv6,你应该看到以下输出。
02/22/2022-23:24:33.997371 [**] [1:2100498:7] GPL ATTACK_RESPONSE id check returned root [**] [Classification: Potentially Bad Traffic] [Priority: 2] {TCP} 2600:9000:2204:5c00:0018:30b3:e400:93a1:80 -> 2a03:b0c0:0002:00d0:0000:0000:0fc2:b001:41468
如果你的请求使用的是 IPv4,你应该看到以下输出。
02/22/2022-23:21:46.783476 [**] [1:2100498:7] GPL ATTACK_RESPONSE id check returned root [**] [Classification: Potentially Bad Traffic] [Priority: 2] {TCP} 204.246.178.81:80 -> 164.90.192.1:36364
Suricata 还会以 JSON 格式将事件记录到 /var/log/suricata/eve.log 文件。要读取和解析这些记录,你需要安装 jq,这超出了本教程的范围。
第二部分
教程的第一部分已经结束,我们安装并测试了 Suricata。下一部分将安装 ELK 技术栈,并将其配置为可视化 Suricata 及其日志。除非另有说明,第二部分应在第二台服务器上完成。
步骤 7 - 安装 Elasticsearch 和 Kibana
安装 Elasticsearch 的第一步是将 Elastic 的 GPG 密钥添加到你的服务器。
$ sudo rpm --import https://artifacts.elastic.co/GPG-KEY-elasticsearch
通过创建并打开 /etc/yum/yum.repos.d/elasticsearch.repo 文件来为 Elasticsearch 软件包创建仓库。
$ sudo nano /etc/yum.repos.d/elasticsearch.repo
在其中粘贴以下代码。
[elasticsearch]
name=Elasticsearch repository for 8.x packages
baseurl=https://artifacts.elastic.co/packages/8.x/yum
gpgcheck=1
gpgkey=https://artifacts.elastic.co/GPG-KEY-elasticsearch
enabled=0
autorefresh=1
type=rpm-md
按 Ctrl + X 保存文件,并在提示时输入 Y 确认。
安装 Elasticsearch 和 Kibana。
$ sudo dnf install --enablerepo=elasticsearch elasticsearch kibana
由于我们将该仓库默认设为禁用,因此每次安装时都需要使用 --enablerepo=elasticsearch 参数。这样可以避免这些软件包被意外升级。
Elasticsearch 安装完成后,你将看到以下输出。
--------------------------- Security autoconfiguration information ------------------------------

Authentication and authorization are enabled.
TLS for the transport and HTTP layers is enabled and configured.

The generated password for the elastic built-in superuser is : ilc+Gju=gZTxQHI4cSkF

If this node should join an existing cluster, you can reconfigure this with
'/usr/share/elasticsearch/bin/elasticsearch-reconfigure-node --enrollment-token <token-here>'
after creating an enrollment token on your existing cluster.

You can complete the following actions at any time:

Reset the password of the elastic built-in superuser with
'/usr/share/elasticsearch/bin/elasticsearch-reset-password -u elastic'.

Generate an enrollment token for Kibana instances with
 '/usr/share/elasticsearch/bin/elasticsearch-create-enrollment-token -s kibana'.

Generate an enrollment token for Elasticsearch nodes with
'/usr/share/elasticsearch/bin/elasticsearch-create-enrollment-token -s node'.

-------------------------------------------------------------------------------------------------
使用以下命令查找你服务器的私有 IP 地址。
$ ip -brief address show
lo               UNKNOWN        127.0.0.1/8 ::1/128
eth0             UP             37.27.84.123/32 2a01:4f9:c012:db02::1/64 fe80::9400:3ff:fe34:d589/64
eth1             UP             10.0.0.2/32 fe80::8400:ff:fe84:5baf/64
记下你服务器的私有 IP(本例中为 10.0.0.2)。在后续内容中我们将它称为 your_private_IP(你的私有 IP)。服务器的公网 IP(37.27.84.123)在后续教程中将称为 your_public_IP(你的公网 IP)。同时,记下你服务器的网络名称 eth1。
步骤 8 - 配置 Elasticsearch
Elasticsearch 的配置文件位于 /etc/elasticsearch/elasticsearch.yml。打开该文件进行编辑。
$ sudo nano /etc/elasticsearch/elasticsearch.yml
默认情况下,Elasticsearch 仅接受本地连接。我们需要修改这一设置,以便 Kibana 能够通过私有 IP 地址访问它。
找到 #network.host: 192.168.0.1 这一行,并在其正下方添加如下所示的一行。
# By default Elasticsearch is only accessible on localhost. Set a different
# address here to expose this node on the network:
#
#network.host: 192.168.0.1
network.bind_host: ["127.0.0.1", "your_private_IP"]
#
# By default Elasticsearch listens for HTTP traffic on the first free port it
# finds starting at 9200. Set a specific HTTP port here:
这样可以确保在通过私有 IP 地址为 Kibana 提供访问的同时,Elastic 仍能接受本地连接。
下一步是开启一些安全特性,并确保 Elastic 配置为以单节点模式运行。为此,请在文件末尾添加以下行。
. . .
discovery.type: single-node
如果你打算使用多个 Elasticsearch 节点,可以省略这一项。
此外,请在下面这一行前加上井号(#)将其注释掉。
#cluster.initial_master_nodes: ["elastic"]
完成后,按 Ctrl + X 保存文件,并在提示时输入 Y 确认。
配置 JVM 堆大小
在启动 Elasticsearch 之前,我们需要配置其使用的内存。创建并打开 /etc/elasticsearch/jvm.options.d/jvm-heap.options 文件进行编辑。
$ sudo nano /etc/elasticsearch/jvm.options.d/jvm-heap.options
在其中粘贴以下行。
-Xms3g
-Xmx3g
按 Ctrl + X 保存文件,并在提示时输入 Y 确认。此处我们为 Elasticsearch 分配了 3GB 内存。请根据你的服务器规模选择合适的数值。
配置防火墙
为 Elasticsearch 添加正确的防火墙规则,使其可以通过私有网络访问。
$ sudo firewall-cmd --permanent --zone=internal --change-interface=eth1
$ sudo firewall-cmd --permanent --zone=internal --add-service=elasticsearch
$ sudo firewall-cmd --permanent --zone=internal --add-service=kibana
$ sudo firewall-cmd --permanent --add-port=5601/tcp
$ sudo firewall-cmd --reload
请确保在第一条命令中选择你在步骤 7 中获取的接口名称。上述命令将防火墙的默认区域改为 internal,并为 Elasticsearch 开放 9200 和 9300 端口,为 Kibana 开放 5601 端口。
启动 Elasticsearch
现在 Elasticsearch 已经配置完成,是时候启动该服务了。
重新加载系统守护进程。
$ sudo systemctl daemon-reload
启用并启动 Elasticsearch 服务器。
$ sudo systemctl enable elasticsearch --now
检查服务的状态。
$ sudo systemctl status elasticsearch
? elasticsearch.service - Elasticsearch
     Loaded: loaded (/usr/lib/systemd/system/elasticsearch.service; enabled; preset: disabled)
     Active: active (running) since Sun 2024-04-14 03:51:12 UTC; 1min 20s ago
       Docs: https://www.elastic.co
   Main PID: 5987 (java)
      Tasks: 74 (limit: 22569)
     Memory: 3.4G
        CPU: 50.532s
     CGroup: /system.slice/elasticsearch.service
创建 Elasticsearch 密码
启用 Elasticsearch 的安全设置后,下一步是为 Elasticsearch 超级用户生成密码。安装过程中提供了默认密码,你可以使用它,但建议进行修改。
运行以下命令重置 Elasticsearch 密码。请选择一个强密码。
$ sudo /usr/share/elasticsearch/bin/elasticsearch-reset-password -u elastic -i
This tool will reset the password of the [elastic] user.
You will be prompted to enter the password.
Please confirm that you would like to continue [y/N]y


Enter password for [elastic]: <ENTER-PASSWORD>
Re-enter password for [elastic]: <CONFIRM-PASSWORD>
Password for the [elastic] user successfully reset.
现在,我们来测试一下 Elasticsearch 是否能正常响应查询。
$ sudo curl --cacert /etc/elasticsearch/certs/http_ca.crt -u elastic https://localhost:9200
Enter host password for user 'elastic':
{
  "name" : "elastic",
  "cluster_name" : "elasticsearch",
  "cluster_uuid" : "VSP7LEZURF6SR8I1BPF9RQ",
  "version" : {
    "number" : "8.13.2",
    "build_flavor" : "default",
    "build_type" : "rpm",
    "build_hash" : "16cc90cd2d08a3147ce02b07e50894bc060a4cbf",
    "build_date" : "2024-04-05T14:45:26.420424304Z",
    "build_snapshot" : false,
    "lucene_version" : "9.10.0",
    "minimum_wire_compatibility_version" : "7.17.0",
    "minimum_index_compatibility_version" : "7.0.0"
  },
  "tagline" : "You Know, for Search"
}
这确认了 Elasticsearch 功能完整且运行正常。
步骤 9 - 配置 Kibana
配置 Kibana 的第一步是将 Elasticsearch 的证书复制到 Kibana 目录。
$ sudo cp /etc/elasticsearch/certs/http_ca.crt /etc/kibana/
接下来,通过生成密钥来启用 xpack 安全功能。Kibana 使用这些密钥在 Elasticsearch 中存储数据。生成密钥的工具位于 /usr/share/kibana/bin 目录。
$ sudo /usr/share/kibana/bin/kibana-encryption-keys generate -q
-q 参数会抑制命令的使用说明输出。你将收到类似以下的输出。
xpack.encryptedSavedObjects.encryptionKey: fdce3576894a0a7b12a639a40f643acd
xpack.reporting.encryptionKey: 92f426be0f487b7d8dd191b86443f2a6
xpack.security.encryptionKey: 34bf00781dbe85d1dcd99dc94ef1c9b7
复制该输出。
打开 Kibana 的配置文件 /etc/kibana/kibana.yml 进行编辑。
$ sudo nano /etc/kibana/kibana.yml
将上一条命令的输出代码粘贴到文件末尾。
. . .

# Maximum number of documents loaded by each shard to generate autocomplete suggestions.
# This value must be a whole number greater than zero. Defaults to 100_000
#unifiedSearch.autocomplete.valueSuggestions.terminateAfter: 100000

xpack.encryptedSavedObjects.encryptionKey: fdce3576894a0a7b12a639a40f643acd
xpack.reporting.encryptionKey: 92f426be0f487b7d8dd191b86443f2a6
xpack.security.encryptionKey: 34bf00781dbe85d1dcd99dc94ef1c9b7
配置 Kibana 主机
需要对 Kibana 进行配置,使其能够通过服务器的私有 IP 地址访问。在文件中找到 #server.host: "localhost" 这一行,并在其正下方添加如下所示的一行。
# Kibana is served by a back end server. This setting specifies the port to use.
#server.port: 5601

# Specifies the address to which the Kibana server will bind. IP addresses and host names are both valid values.
# The default is 'localhost', which usually means remote machines will not be able to connect.
# To allow connections from remote users, set this parameter to a non-loopback address.
#server.host: "localhost"
server.host: "your_private_IP"
关闭遥测
默认情况下,Kibana 会将数据发送回其服务器。这会影响性能,也存在隐私风险。因此,你应该关闭遥测(Telemetry)。在文件末尾添加以下代码以关闭遥测。第一项设置用于关闭遥测,第二项设置则禁止从 Kibana 的高级设置中覆盖第一项设置。
telemetry.optIn: false
telemetry.allowChangingOptInStatus: false
配置 SSL
找到变量 elasticsearch.ssl.certificateAuthorities,取消其注释,并按如下所示修改其值。
elasticsearch.ssl.certificateAuthorities: [ "/etc/kibana/http_ca.crt" ]
完成后,按 Ctrl + X 保存文件,并在提示时输入 Y 确认。
配置 Kibana 访问
下一步是生成一个注册令牌(enrollment token),稍后我们将用它登录 Kibana Web 界面。
$ sudo /usr/share/elasticsearch/bin/elasticsearch-create-enrollment-token -s kibana
eyJ2ZXIiOiI4LjEzLjIiLCJhZHIiOlsiMzcuMjcuODQuMTIzOjkyMDAiXSwiZmdyIjoiMmI2ZjhhOWRiOWJjMDU5NDk0NGE0OGFkMjMxODg2NzYxNTViZGViN2U5YjY4MmY3N2MzYmI3ZDk2Nzc3YjY0NyIsImtleSI6InppVU0zSTRCOE5lSHBLU3k2T0owOnBLNHJiWjBZVHYybWNTbmxrTXlqbncifQ==
启动 Kibana
既然你已经为 Kibana 配置好了安全访问和网络,现在启动并启用该进程。
$ sudo systemctl enable kibana --now
检查其状态,确认是否正在运行。
$ sudo systemctl status kibana
? kibana.service - Kibana
     Loaded: loaded (/usr/lib/systemd/system/kibana.service; enabled; preset: disabled)
     Active: active (running) since Sun 2024-04-14 04:25:54 UTC; 963ms ago
       Docs: https://www.elastic.co
   Main PID: 6464 (node)
      Tasks: 7 (limit: 22569)
     Memory: 48.2M
        CPU: 1.238s
     CGroup: /system.slice/kibana.service
             ??6464 /usr/share/kibana/bin/../node/bin/node /usr/share/kibana/bin/../src/cli/dist

Apr 14 04:25:54 elastic systemd[1]: Started Kibana.
.....
步骤 10 - 访问 Kibana 仪表盘
由于 Kibana 被配置为只能通过私有 IP 地址访问 Elasticsearch,你有两种方式访问它。第一种方法是从你的电脑通过 SSH 隧道连接到 Elasticsearch 服务器。这会将你电脑上的 5601 端口转发到服务器的私有 IP 地址,之后你就可以在电脑上通过 http://localhost:5601 访问 Kibana。但这种方式意味着你无法从其他任何地方访问它。
另一种选择是在你的 Suricata 服务器上安装 Nginx,并将其作为反向代理,通过私有 IP 地址访问 Elasticsearch 服务器。我们将讨论这两种方式。你可以根据自己的需求任选其一。
使用 SSH 本地隧道
如果你使用的是 Windows 10 或 Windows 11,可以从 Windows PowerShell 运行 SSH 本地隧道。在 Linux 或 macOS 上,你可以使用终端。如果你尚未配置 SSH 访问,可能需要先进行配置。
在你的电脑终端中运行以下命令以创建 SSH 隧道。
$ ssh -L 5601:your_private_IP:5601 navjot@your_public_IP -N
- -L 参数表示本地 SSH 隧道,用于将流量从你电脑的端口转发到服务器。
- private_IP:5601 是流量在服务器上被转发到的 IP 地址。此处请将其替换为你 Elasticsearch 服务器的私有 IP 地址。
- your_public_IP 是 Elasticsearch 服务器的公网 IP 地址,用于建立 SSH 连接。
- -N 参数告诉 OpenSSH 不执行任何命令,但在隧道运行期间保持连接存活。
隧道建立后,你可以在电脑浏览器中打开 http://localhost:5601 来访问 Kibana。你将看到以下界面。
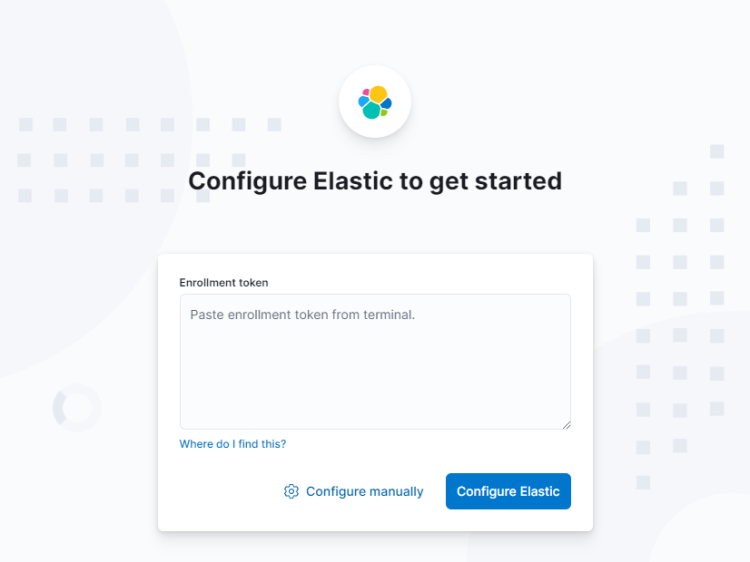
只要你需要访问 Kibana,就需要让该命令保持运行。在终端中按 Ctrl + C 即可关闭隧道。
使用 Nginx 反向代理
如果你希望从世界各地访问仪表盘,这种方法最为合适。以下所有命令都应在 Elasticsearch 服务器上运行。
安装 Nginx
Rocky Linux 9 自带较旧版本的 Nginx。你需要使用官方 Nginx 仓库来安装最新版本。
创建并打开 /etc/yum.repos.d/nginx.repo 文件进行编辑。
$ sudo nano /etc/yum.repos.d/nginx.repo
在其中粘贴以下代码。
[nginx-stable]
name=nginx stable repo
baseurl=http://nginx.org/packages/centos/$releasever/$basearch/
gpgcheck=1
enabled=0
gpgkey=https://nginx.org/keys/nginx_signing.key
module_hotfixes=true

[nginx-mainline]
name=nginx mainline repo
baseurl=http://nginx.org/packages/mainline/centos/$releasever/$basearch/
gpgcheck=1
enabled=1
gpgkey=https://nginx.org/keys/nginx_signing.key
module_hotfixes=true
完成后,按 Ctrl + X 保存文件,并在提示时输入 Y 确认。我们将使用 Nginx 的 mainline 版本,因此在上文中通过在 mainline 部分下设置 enabled=1 启用了 mainline 仓库,而非 stable 仓库。你可以任选其一。
安装 Nginx。
$ sudo dnf install -y nginx
验证安装。
$ nginx -v
nginx version: nginx/1.25.4
启用并启动 Nginx 服务。
$ sudo systemctl enable nginx --now
配置防火墙
在继续之前,你需要在防火墙中开放 HTTP 和 HTTPS 端口。
$ sudo firewall-cmd --permanent --add-service=http
$ sudo firewall-cmd --permanent --add-service=https
重新加载防火墙以使更改生效。
$ sudo firewall-cmd --reload
安装并配置 SSL
第一步是安装 Let's Encrypt 的 SSL 证书。为此,我们需要先安装 EPEL 仓库。
$ sudo dnf install -y epel-release
安装 Certbot 以及相应的 Nginx 插件。
$ sudo dnf install -y certbot python3-certbot-nginx
为域名 kibana.example.com 生成 SSL 证书。
$ sudo certbot certonly --nginx --agree-tos --no-eff-email --staple-ocsp --preferred-challenges http -m
[email protected]
 -d kibana.example.com
上述命令会将证书下载到服务器上的 /etc/letsencrypt/live/kibana.example.com 目录。
生成 Diffie-Hellman 组证书。
$ sudo openssl dhparam -dsaparam -out /etc/ssl/certs/dhparam.pem 4096
启用并启动 Certbot 自动续期定时器。
$ sudo systemctl enable certbot-renew.timer
$ sudo systemctl start certbot-renew.timer
查看定时器列表。
$ sudo systemctl list-timers
NEXT                        LEFT         LAST                        PASSED    UNIT                         ACTIVATES
---------------------------------------------------------------------------------------------------------------------------------
Mon 2024-04-15 00:00:00 UTC 19min left   Sun 2024-04-14 08:20:34 UTC 15h ago   logrotate.timer              logrotate.service
Mon 2024-04-15 00:43:16 UTC 1h 2min left Sun 2024-04-14 09:01:33 UTC 14h ago   fstrim.timer                 fstrim.service
Mon 2024-04-15 00:44:47 UTC 1h 4min left Sun 2024-04-14 23:30:19 UTC 10min ago dnf-makecache.timer          dnf-makecache.service
Mon 2024-04-15 06:52:31 UTC 7h left      -                           -         certbot-renew.timer          certbot-renew.service
进行一次预演(dry run),以检查 SSL 续期是否正常工作。
$ sudo certbot renew --dry-run
如果没有看到错误,说明一切就绪。你的证书将自动续期。
配置 Nginx
创建并打开 Kibana 的 Nginx 配置文件。
$ sudo nano /etc/nginx/conf.d/kibana.conf
在其中粘贴以下代码。请将 IP 地址替换为你 Elasticsearch 服务器的私有 IP 地址。
server {
  listen 80; listen [::]:80;
  server_name kibana.example.com;
  return 301 https://$host$request_uri;
}

server {
  server_name kibana.example.com;
  charset utf-8;

  listen 443 ssl;
  listen [::]:443 ssl;
  http2 on;
  http3 on;
  quic_retry on;


  access_log /var/log/nginx/kibana.access.log;
  error_log /var/log/nginx/kibana.error.log;

  ssl_certificate /etc/letsencrypt/live/kibana.example.com/fullchain.pem;
  ssl_certificate_key /etc/letsencrypt/live/kibana.example.com/privkey.pem;
  ssl_trusted_certificate /etc/letsencrypt/live/kibana.example.com/chain.pem;
  ssl_session_timeout 1d;
  ssl_session_cache shared:MozSSL:10m;
  ssl_session_tickets off;

  ssl_protocols TLSv1.2 TLSv1.3;
  ssl_ciphers ECDHE-ECDSA-AES128-GCM-SHA256:ECDHE-RSA-AES128-GCM-SHA256:ECDHE-ECDSA-AES256-GCM-SHA384:ECDHE-RSA-AES256-GCM-SHA384:ECDHE-ECDSA-CHACHA20-POLY1305:ECDHE-RSA-CHACHA20-POLY1305:DHE-RSA-AES128-GCM-SHA256:DHE-RSA-AES256-GCM-SHA384;
  ssl_ecdh_curve X25519:prime256v1:secp384r1:secp521r1;
  ssl_prefer_server_ciphers off;

  resolver 8.8.8.8;

  ssl_stapling on;
  ssl_stapling_verify on;
  ssl_dhparam /etc/ssl/certs/dhparam.pem;

  location / {
    proxy_pass http://your_private_IP:5601;
    proxy_set_header Host $host;
    proxy_set_header X-Real-IP $remote_addr;
    proxy_set_header X-Forwarded-For $proxy_add_x_forwarded_for;
    proxy_set_header X-Forwarded-Proto $scheme;
  }
}
按 Ctrl + X 保存文件,并在提示时输入 Y 确认。
打开 /etc/nginx/nginx.conf 文件进行编辑。
$ sudo nano /etc/nginx/nginx.conf
在 include /etc/nginx/conf.d/*.conf; 这一行之前添加以下行。
server_names_hash_bucket_size 64;
按 Ctrl + X 保存文件,并在提示时输入 Y 确认。
验证配置。
$ sudo nginx -t
nginx: the configuration file /etc/nginx/nginx.conf syntax is ok
nginx: configuration file /etc/nginx/nginx.conf test is successful
启动 Nginx 服务。
$ sudo systemctl start nginx
接下来,你需要在 Kibana 的配置中添加 base URL 字段。
打开 Kibana 的配置文件。
$ sudo nano /etc/kibana/kibana.yml
找到被注释掉的 #server.publicBaseUrl: "" 这一行,去掉前面的井号,并按如下方式修改。
server.publicBaseUrl: "https://kibana.example.com"
按 Ctrl + X 保存文件,并在提示时输入 Y 确认。
重启 Kibana 服务。
$ sudo systemctl restart kibana
配置 SELinux 以启用 Nginx
应用策略,允许向外部主机发起连接。
$ sudo setsebool -P httpd_can_network_connect 1
完成 Kibana 与 Elasticsearch 的配置
等待几分钟,然后在浏览器中打开 https://kibana.example.com。
你将看到注册令牌输入框。填入你在步骤 9 中生成的注册令牌。
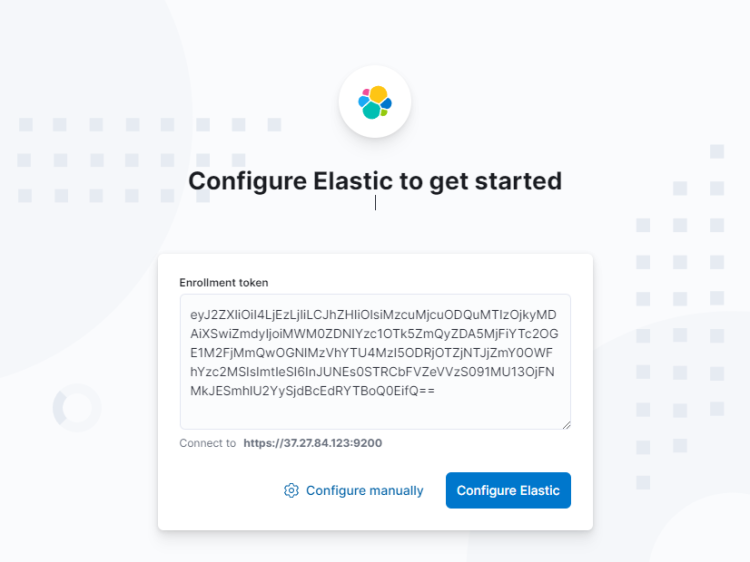
点击 Configure Elastic(配置 Elastic)按钮继续。接下来,系统会要求你输入验证码。
切换回 Elasticsearch 终端,运行以下命令生成验证码。在页面上输入该验证码,然后点击 Verify(验证)按钮继续。
$ sudo /usr/share/kibana/bin/kibana-verification-code
Your verification code is:  232 001
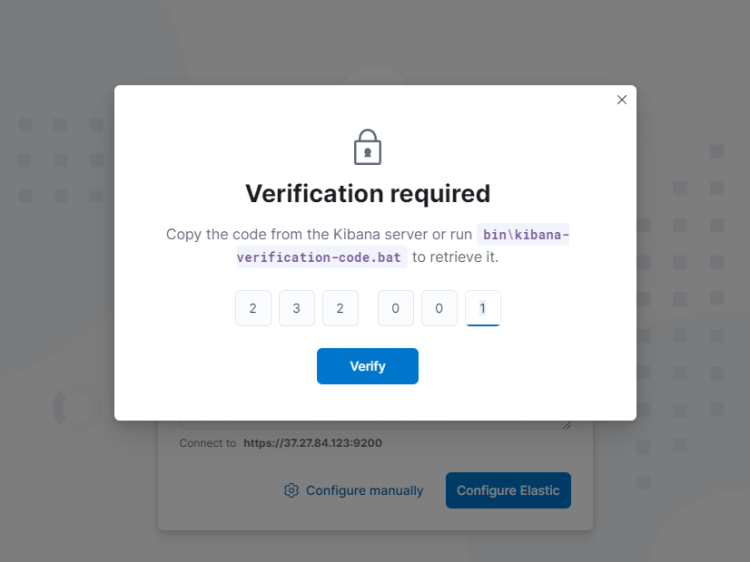
接下来,等待 Elastic 设置完成。这需要几分钟时间。
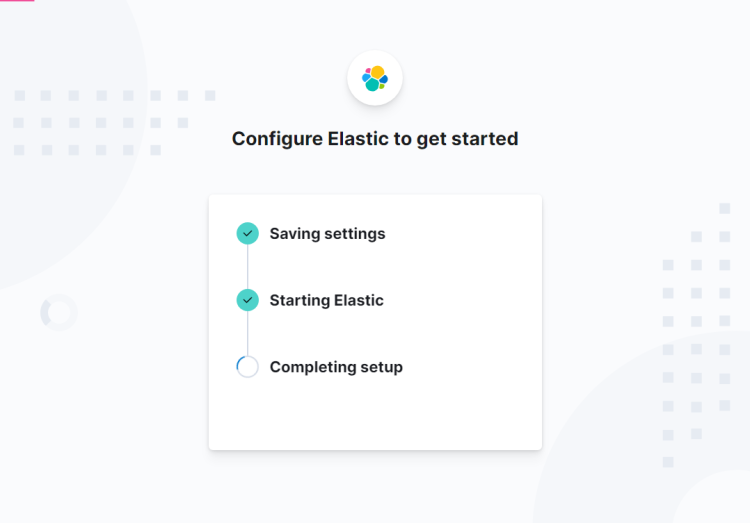
接下来,你将被重定向到登录界面。

步骤 11 - 安装并配置 Filebeat
需要注意的是,我们将在 Suricata 服务器上安装 Filebeat。因此请切换回该服务器,并先添加 Elastic 的 GPG 密钥以开始。
$ sudo rpm --import https://artifacts.elastic.co/GPG-KEY-elasticsearch
创建并打开 Elastic 仓库。
$ sudo nano /etc/yum.repos.d/elasticsearch.repo
粘贴以下代码。
[elasticsearch]
name=Elasticsearch repository for 8.x packages
baseurl=https://artifacts.elastic.co/packages/8.x/yum
gpgcheck=1
gpgkey=https://artifacts.elastic.co/GPG-KEY-elasticsearch
enabled=0
autorefresh=1
type=rpm-md
按 Ctrl + X 保存文件,并在提示时输入 Y 确认。
安装 Filebeat。
$ sudo dnf install --enablerepo=elasticsearch filebeat
在配置 Filebeat 之前,我们需要将 http_ca.crt 文件从 Elasticsearch 服务器复制到 Filebeat 服务器。在 Filebeat 服务器上运行以下命令。
$ scp username@your_public_ip:/etc/elasticsearch/certs/http_ca.crt /etc/filebeat
Filebeat 的配置文件位于 /etc/filebeat/filebeat.yml。打开该文件进行编辑。
$ sudo nano /etc/filebeat/filebeat.yml
你需要做的第一件事是将它连接到 Kibana 仪表盘。在 Kibana 部分找到 #host: "localhost:5601" 这一行,并在其正下方添加如下所示的一行。
. . .
# Starting with Beats version 6.0.0, the dashboards are loaded via the Kibana API.
# This requires a Kibana endpoint configuration.
setup.kibana:

  # Kibana Host
  # Scheme and port can be left out and will be set to the default (http and 5601)
  # In case you specify and additional path, the scheme is required: http://localhost:5601/path
  # IPv6 addresses should always be defined as: https://[2001:db8::1]:5601
  #host: "localhost:5601"
  host: "your_private_IP:5601"
  protocol: "http"
  ssl.enabled: true
  ssl.certificate_authorities: ["/etc/filebeat/http_ca.crt"]

. . .
接下来,找到文件中的 Elasticsearch Output(Elasticsearch 输出)部分,并按如下所示修改 hosts、username 和 password 的值。用户名请使用 elastic,密码请使用本教程步骤 8 中生成的密码。同时,将协议设置为 HTTPS。
output.elasticsearch:
  # Array of hosts to connect to.
  hosts: ["your_private_IP:9200"]

  # Performance preset - one of "balanced", "throughput", "scale",
  # "latency", or "custom".
  preset: balanced

  # Protocol - either `http` (default) or `https`.
  protocol: "https"

  # Authentication credentials - either API key or username/password.
  #api_key: "id:api_key"
  username: "elastic"
  password: "<yourelasticpassword>"
  ssl.certificate_authorities: ["/etc/filebeat/http_ca.crt"]
  ssl.verification_mode: full

. . .
在文件底部添加以下行。
setup.ilm.overwrite: true
完成后,按 Ctrl + X 保存文件,并在提示时输入 Y 确认。要确保 Filebeat 能连接到 Elasticsearch,还有一步操作。我们需要将 Elasticsearch 的 SSL 信息传递给 Filebeat,它才能成功连接。
测试从 Filebeat 到 Elasticsearch 服务器的连接。系统会要求你输入 Elasticsearch 密码。
$ sudo curl -v --cacert /etc/filebeat/http_ca.crt https://your_private_ip:9200 -u elastic
你将获得以下输出。
Enter host password for user 'elastic':
*   Trying 10.0.0.2:9200...
* Connected to 10.0.0.2 (10.0.0.2) port 9200 (#0)
* ALPN, offering h2
* ALPN, offering http/1.1
*  CAfile: /etc/filebeat/http_ca.crt
* TLSv1.0 (OUT), TLS header, Certificate Status (22):
* TLSv1.3 (OUT), TLS handshake, Client hello (1):
* TLSv1.2 (IN), TLS header, Certificate Status (22):
* TLSv1.3 (IN), TLS handshake, Server hello (2):
* TLSv1.2 (IN), TLS header, Finished (20):
* TLSv1.2 (IN), TLS header, Unknown (23):
* TLSv1.3 (IN), TLS handshake, Encrypted Extensions (8):
* TLSv1.3 (IN), TLS handshake, Certificate (11):
* TLSv1.3 (IN), TLS handshake, CERT verify (15):
* TLSv1.3 (IN), TLS handshake, Finished (20):
* TLSv1.2 (OUT), TLS header, Finished (20):
* TLSv1.3 (OUT), TLS change cipher, Change cipher spec (1):
* TLSv1.2 (OUT), TLS header, Unknown (23):
* TLSv1.3 (OUT), TLS handshake, Finished (20):
* SSL connection using TLSv1.3 / TLS_AES_256_GCM_SHA384
* ALPN, server did not agree to a protocol
* Server certificate:
*  subject: CN=elastic
*  start date: Apr 14 08:37:21 2024 GMT
*  expire date: Apr 14 08:37:21 2026 GMT
*  subjectAltName: host "10.0.0.2" matched cert's IP address!
*  issuer: CN=Elasticsearch security auto-configuration HTTP CA
*  SSL certificate verify ok.
* Server auth using Basic with user 'elastic'
* TLSv1.2 (OUT), TLS header, Unknown (23):
> GET / HTTP/1.1
> Host: 10.0.0.2:9200
> Authorization: Basic ZWxhc3RpYzpsaWZlc3Vja3M2NjIwMDI=
> User-Agent: curl/7.76.1
> Accept: */*
>
* TLSv1.2 (IN), TLS header, Unknown (23):
* TLSv1.3 (IN), TLS handshake, Newsession Ticket (4):
* TLSv1.2 (IN), TLS header, Unknown (23):
* Mark bundle as not supporting multiuse
< HTTP/1.1 200 OK
< X-elastic-product: Elasticsearch
< content-type: application/json
< content-length: 532
<
{
  "name" : "elastic",
  "cluster_name" : "elasticsearch",
  "cluster_uuid" : "vnUn8l1bQ1qkF-VjCoiWmQ",
  "version" : {
    "number" : "8.13.2",
    "build_flavor" : "default",
    "build_type" : "rpm",
    "build_hash" : "16cc90cd2d08a3147ce02b07e50894bc060a4cbf",
    "build_date" : "2024-04-05T14:45:26.420424304Z",
    "build_snapshot" : false,
    "lucene_version" : "9.10.0",
    "minimum_wire_compatibility_version" : "7.17.0",
    "minimum_index_compatibility_version" : "7.0.0"
  },
  "tagline" : "You Know, for Search"
}
* Connection #0 to host 10.0.0.2 left intact
接下来,启用 Filebeat 内置的 Suricata 模块。
$ sudo filebeat modules enable suricata
Enabled suricata
打开 /etc/filebeat/modules.d/suricata.yml 文件进行编辑。
$ sudo nano /etc/filebeat/modules.d/suricata.yml
按如下所示编辑该文件。你需要将 enabled 变量的值改为 true。同时,取消 var.paths 变量的注释,并按所示设置其值。
# Module: suricata
# Docs: https://www.elastic.co/guide/en/beats/filebeat/8.10/filebeat-module-suricata.html

- module: suricata
  # All logs
  eve:
    enabled: true

    # Set custom paths for the log files. If left empty,
    # Filebeat will choose the paths depending on your OS.
    var.paths: ["/var/log/suricata/eve.json"]
完成后,按 Ctrl + X 保存文件,并在提示时输入 Y 确认。
配置 Filebeat 的最后一步,是使用 filebeat setup 命令将 SIEM 仪表盘和管道(pipeline)加载到 Elasticsearch 中。
$ sudo filebeat setup
该命令可能需要几分钟才能完成。完成后,你应该收到以下输出。
Index setup finished.
Loading dashboards (Kibana must be running and reachable)
Loaded dashboards
Loaded Ingest pipelines
启动并启用 Filebeat 服务。
$ sudo systemctl enable filebeat --now
检查服务的状态。
$ sudo systemctl status filebeat
? filebeat.service - Filebeat sends log files to Logstash or directly to Elasticsearch.
     Loaded: loaded (/usr/lib/systemd/system/filebeat.service; enabled; preset: disabled)
     Active: active (running) since Sun 2024-04-14 10:12:51 UTC; 31s ago
       Docs: https://www.elastic.co/beats/filebeat
   Main PID: 7299 (filebeat)
      Tasks: 8 (limit: 22569)
     Memory: 407.2M
        CPU: 7.640s
     CGroup: /system.slice/filebeat.service
             ??7299 /usr/share/filebeat/bin/filebeat --environment systemd -c /etc/filebeat/filebeat.yml --path.home /usr/share/filebeat --path.config /etc/filebeat..........
步骤 12 - 管理 Kibana 仪表盘
打开 https://kibana.example.com,你将再次进入登录界面。
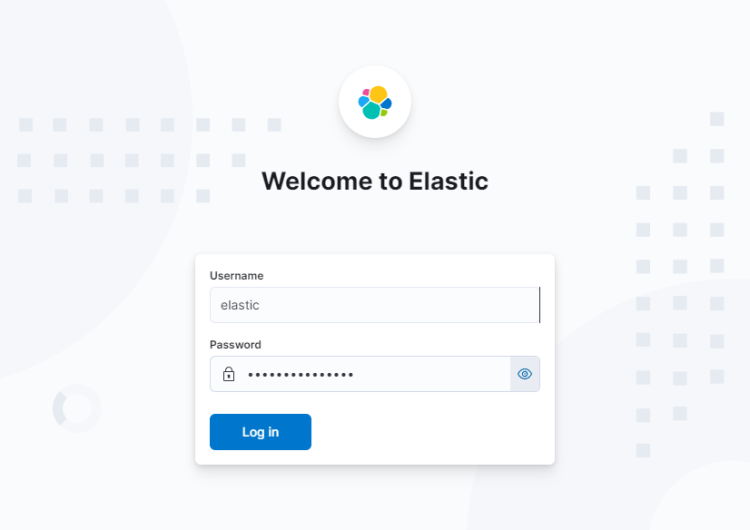
使用用户名 elastic 以及你之前生成的密码登录,你将看到以下界面。

点击 Explore on my own(自行探索)链接,进入仪表盘。
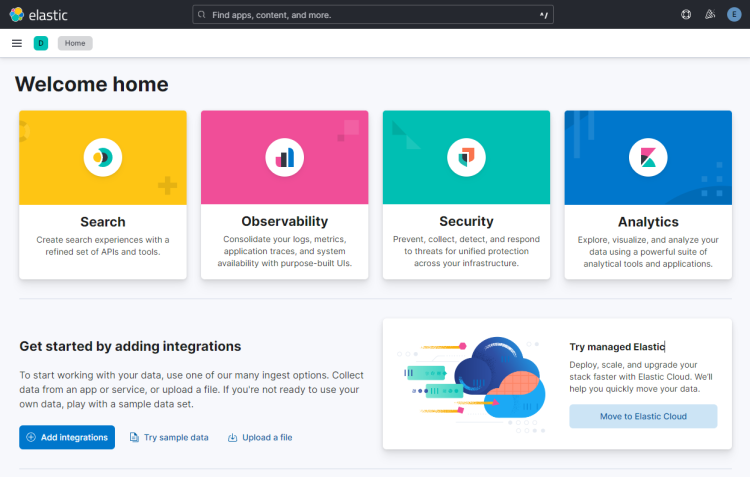
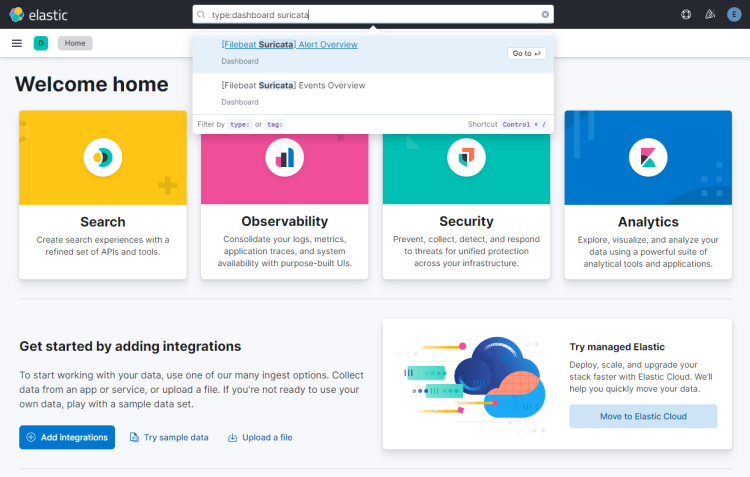
在顶部的搜索框中输入 type:data suricata,以查找 Suricata 的相关信息。
点击第一个结果([Filebeat Suricata] Alert Overview),你将看到类似的界面。默认情况下,它只显示最近 15 分钟的记录,但为了在教程中展示更多数据,我们将其时间范围扩大了。
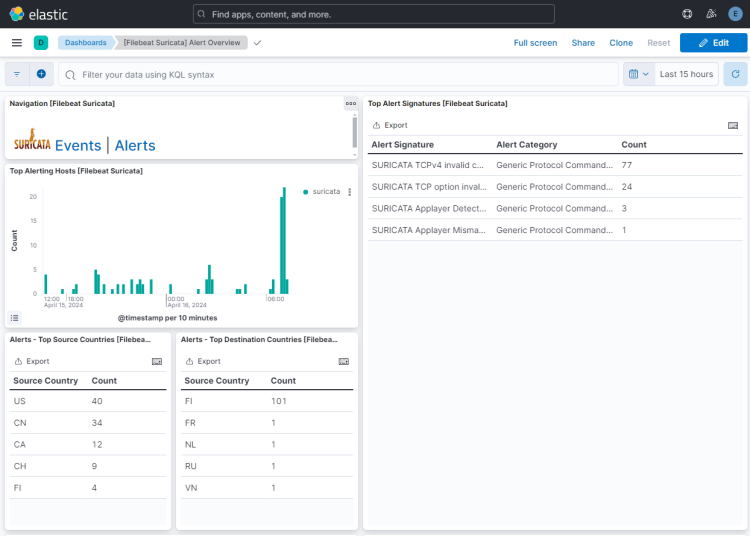
点击 Events(事件)按钮,查看所有已记录的事件。
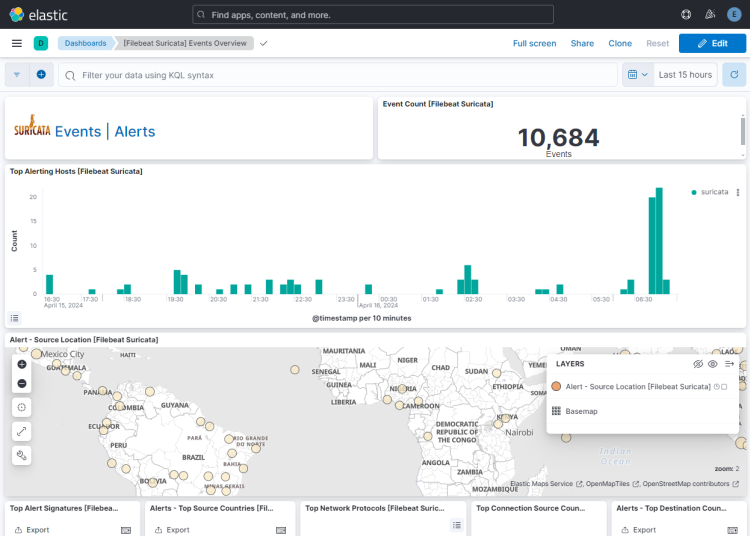
在事件和告警页面中向下滚动,你可以根据协议类型、源端口和目的端口以及源的 IP 地址来识别每条事件和告警。你还可以查看流量来源的国家/地区。
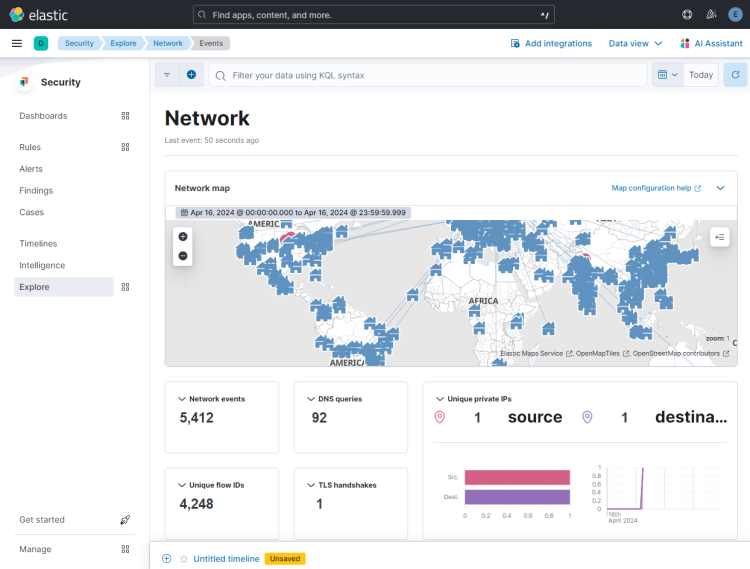
你可以使用 Kibana 和 Filebeat 访问并生成其他类型的仪表盘。其中一个开箱即用的实用内置仪表盘是安全(Security)仪表盘。从左侧汉堡菜单中点击 Security 仪表盘,选择 Explore,然后在右侧选择 Network 仪表盘。
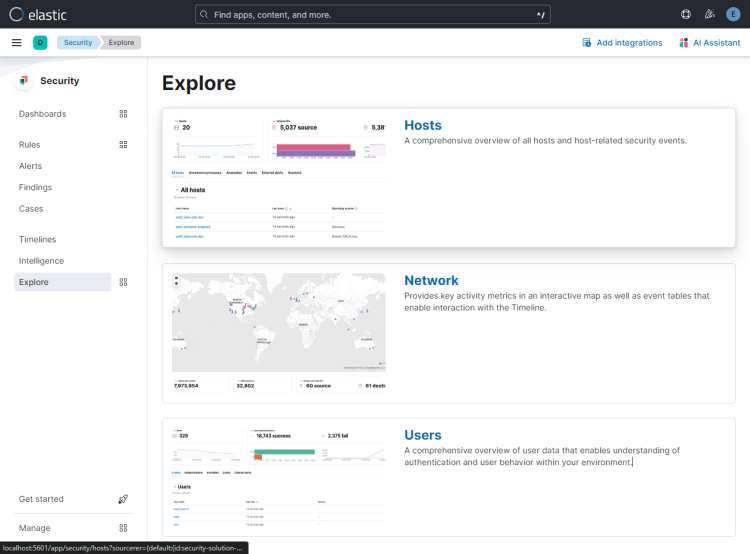
你将看到以下页面。
你还可以通过启用并配置 Filebeat 的内置模块,添加更多类似 Nginx 的仪表盘。
总结
至此,本教程关于在 Rocky Linux 9 服务器上安装并配置 Suricata IDS 与 Elastic Stack 的内容就全部结束了。你还配置了 Nginx 作为反向代理,以便从外部访问 Kibana 仪表盘。如果你有任何问题,请在下方评论区留言。