
本教程适用于以下操作系统版本
- Ubuntu 24.04(Noble Numbat)
- Ubuntu 22.04(Jammy Jellyfish)
- Ubuntu 20.04(Focal Fossa)
- Ubuntu 18.04(Bionic Beaver)
本页内容
- 准备工作
- 在 Ubuntu 上安装 Grafana(安装依赖并添加软件源、安装并配置 Grafana、将 Nginx 配置为反向代理)
- 安装并配置 Prometheus(安装 Prometheus、配置 Prometheus、将 Prometheus 作为 systemd 服务运行)
- 安装 node_exporter
- 将 node_exporter 集成到 Prometheus
- 将 Prometheus 作为数据源集成到 Grafana
- 总结
- 安装依赖并添加软件源
- 安装并配置 Grafana
- 将 Nginx 配置为反向代理
- 安装 Prometheus
- 配置 Prometheus
- 将 Prometheus 作为 systemd 服务运行
Grafana 是由 Grafana Labs 开发的、开源且跨平台的数据可视化平台。它提供了一个包含图表、图形和告警功能的交互式数据可视化 Web 应用。借助 Grafana,你可以查询、可视化、设置告警,并探索时序数据库(TSDB)的指标、日志和链路追踪数据。它是一个强大的工具,能够将时序数据库(TSDB)数据转化为直观的图表与可视化。
在 Grafana 中,你可以通过「数据源(Data Source)」添加时序数据库数据。Grafana 支持多种数据源,例如 Prometheus、InfluxDB、PostgreSQL、Loki、Jaeger、Graphite、Google Cloud Monitoring、AWS CloudWatch、Azure Monitor 等等。
在本教程中,你将学习如何在 Ubuntu 24.04 服务器上安装 Grafana、Prometheus 和 node_exporter。你还会安装 Nginx 作为 Grafana 的反向代理,将 node_exporter 与 Prometheus 集成,然后将 Prometheus 作为数据源添加到 Grafana 仪表盘。
准备工作
在开始之前,请确保你具备以下条件:
- 两台或三台 Ubuntu 24.04 服务器。
- 一个具备管理员权限的普通(非 root)用户。
在 Ubuntu 上安装 Grafana
Grafana 是一款用于数据可视化的 Web 应用。要安装 Grafana,你需要添加 Grafana 软件仓库。在本示例中,你还会安装 Nginx 作为 Grafana 的反向代理。
安装依赖并添加软件源
在本节中,你将安装包括 Nginx 在内的依赖,然后添加 Grafana 软件仓库。
首先,运行以下命令安装 Grafana 所需的依赖。输入 Y 确认安装。
sudo apt install gnupg2 apt-transport-https software-properties-common wget nginx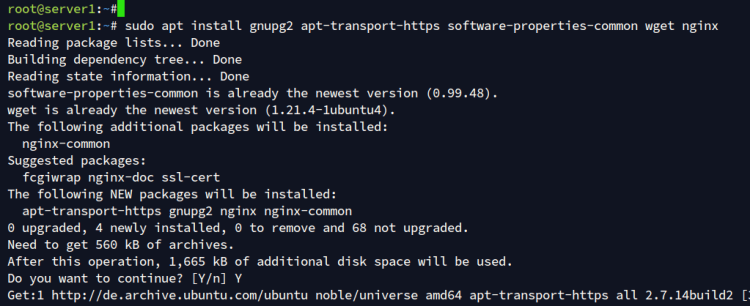
现在,使用以下命令添加 Grafana 的 GPG 密钥与软件仓库。
wget -q -O - https://packages.grafana.com/gpg.key > grafana.key cat grafana.key | gpg --dearmor | sudo tee /etc/apt/trusted.gpg.d/grafana.gpg > /dev/nullecho ‘deb [signed-by=/etc/apt/trusted.gpg.d/grafana.gpg] https://packages.grafana.com/oss/deb stable main’ | sudo tee /etc/apt/sources.list.d/grafana.list然后,运行以下命令更新并刷新你的软件包索引:
sudo apt update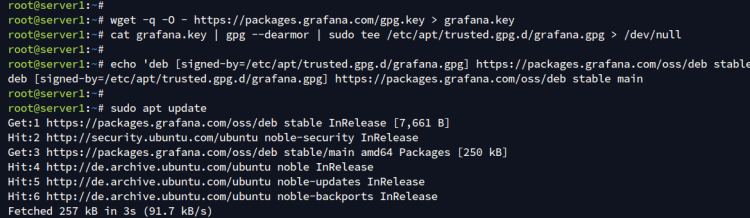
安装并配置 Grafana
添加 Grafana 软件仓库后,你将使用 APT 包管理器安装 Grafana 软件包,然后将 Grafana 配置为在本地(localhost)以类似 howtoforge.local 的域名运行。
要安装 Grafana,运行以下 apt 命令。输入 Y 继续安装。
sudo apt install grafana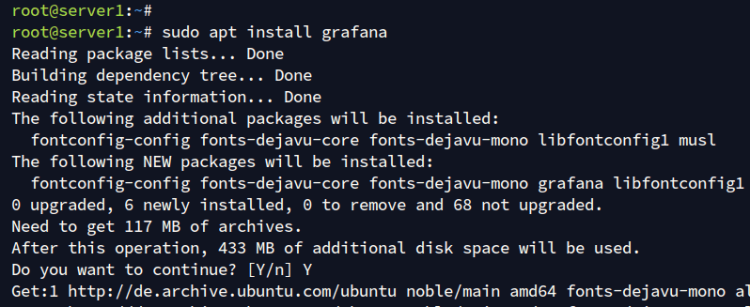
安装完成后,运行以下命令重新加载 systemd 管理器:
sudo systemctl daemon-reload现在,你可以使用以下 systemctl 命令启动并设置 grafana-server 开机自启。然后,验证服务是否正在运行。
sudo systemctl enable --now grafana-server
sudo systemctl status grafana-server
在下面的输出中,你可以看到 grafana-server 正在运行且已启用。
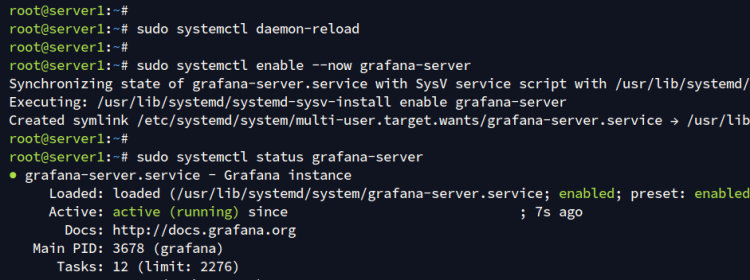
grafana-server 运行后,你将其配置为在 localhost 上运行。
使用 nano 编辑器打开 Grafana 配置文件 /etc/grafana/grafana.ini。
sudo nano /etc/grafana/grafana.ini将默认配置修改为以下内容。请确保将 domain 选项改为你的 Grafana 本地域名。在本示例中,你将在 howtoforge.local 域名下运行 Grafana。
[server]

# The IP address to bind to, empty will bind to all interfaces
http_addr = localhost

# The http port  to use
http_port = 3000

# The public facing domain name used to access grafana from a browser
domain = howtoforge.local
完成后,保存文件并退出编辑器。
现在运行以下命令重启 grafana-server 以使配置生效。这样,Grafana 将会在 localhost 上以默认 HTTP 端口 3000 运行。
sudo systemctl restart grafana-server将 Nginx 配置为反向代理
在本节中,你将新建一个 Nginx 服务器块,作为运行在 localhost、端口 3000 的 grafana-server 的反向代理。
使用 nano 编辑器新建 Nginx 服务器块配置文件 /etc/nginx/sites-available/grafana.conf。
sudo nano /etc/nginx/sites-available/grafana.conf添加以下配置,将 Nginx 设置为 Grafana 的反向代理。请确保将 server_name 选项改为你的 Grafana 域名。
# this is required to proxy Grafana Live WebSocket connections.
map $http_upgrade $connection_upgrade {
  default upgrade;
  '' close;
}

server {
    listen      80;
    server_name howtoforge.local;

  root /usr/share/nginx/html;
  index index.html index.htm;


  access_log /var/log/nginx/grafana-access.log;
  error_log /var/log/nginx/grafana-error.log;

  location / {
    proxy_set_header Host $http_host;
    proxy_pass http://localhost:3000/;
  }

  # Proxy Grafana Live WebSocket connections.
  location /api/live {
    rewrite  ^/(.*)  /$1 break;
    proxy_http_version 1.1;
    proxy_set_header Upgrade $http_upgrade;
    proxy_set_header Connection $connection_upgrade;
    proxy_set_header Host $http_host;
    proxy_pass http://localhost:3000/;
  }
}
保存文件并退出编辑器。
现在运行以下命令启用 grafana.conf 服务器块并验证 Nginx 配置语法。如果语法正确,你将看到输出 test is successful - syntax is OK。
sudo ln -s /etc/nginx/sites-available/grafana.conf /etc/nginx/sites-enabled/
sudo nginx -t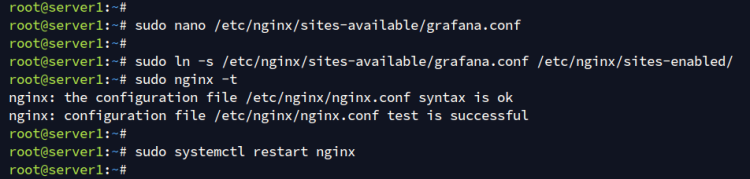
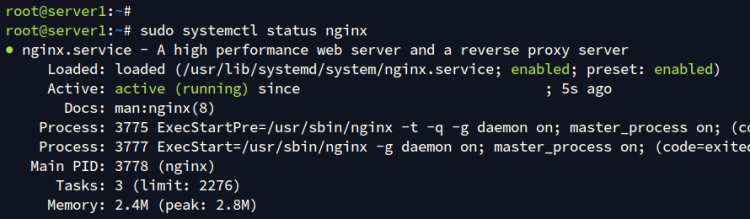
接下来,运行以下 systemctl 命令重启并验证 Nginx Web 服务器状态。
sudo systemctl restart nginx
sudo systemctl status nginx
你将看到 Nginx Web 服务器正在运行:
接下来,访问你的 Grafana 域名,例如 http://howtoforge.local/。如果安装成功,你将看到 Grafana 登录页面。
使用默认用户名 admin 和密码 admin 登录。

登录后,为你的 Grafana 安装设置新密码,并点击 Submit 确认。

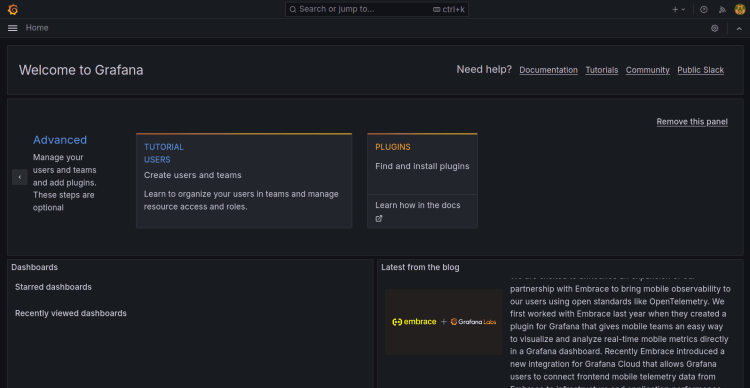
你将看到类似下图的 Grafana 仪表盘:
安装并配置 Prometheus
Prometheus 是一个监控与告警平台。在 Grafana 运行的情况下,你将在服务器 192.168.5.16 上安装 Prometheus。
安装 Prometheus
在本节中,你将通过下载 Prometheus 二进制文件到系统来手动安装 Prometheus。在此之前,你还会新建一个系统用户 prometheus。
首先,运行以下命令新增用户和组 prometheus。
sudo groupadd --system prometheus
sudo useradd -s /sbin/nologin --system -g prometheus prometheus
新建数据目录 /var/lib/prometheus 以及配置目录 /etc/prometheus。
sudo mkdir -p /var/lib/prometheus
for i in rules rules.d files_sd; do sudo mkdir -p /etc/prometheus/${i}; done
使用以下命令下载适用于 Linux 的 Prometheus 最新版本。
curl -s https://api.github.com/repos/prometheus/prometheus/releases/latest|grep browser_download_url|grep linux-amd64|cut -d ‘"’ -f 4|wget -qi -下载完成后,使用 tar 命令解压 Prometheus 二进制文件并进入目录。
tar xvf prometheus*.tar.gz
cd prometheus*/
将二进制文件 prometheus 和 promtool 移动到 /usr/local/bin 目录,然后将配置目录及文件 prometheus.yml 移动到 /etc/prometheus 目录。
sudo mv prometheus promtool /usr/local/bin/
sudo mv consoles console_libraries prometheus.yml /etc/prometheus/
最后,运行以下命令将 Prometheus 配置与数据目录的权限和属主改为用户 prometheus。
for i in rules rules.d files_sd; do sudo chown -R prometheus:prometheus /etc/prometheus/${i}; done
for i in rules rules.d files_sd; do sudo chmod -R 775 /etc/prometheus/${i}; done
sudo chown -R prometheus:prometheus /var/lib/prometheus/
配置 Prometheus
安装 Prometheus 后,你将使用 basic_auth(基础认证)来保护 Prometheus。
使用以下 apt 命令安装 apache2-utils 软件包。
sudo apt install apache2-utils -y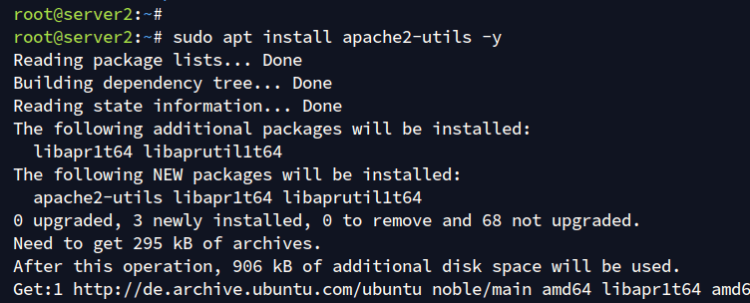
现在运行以下 htpasswd 命令为 admin 用户生成 bcrypt 密码。输入并重复你的密码,然后复制生成的密码。
htpasswd -nB admin接下来,运行以下 nano 命令新建文件 /etc/prometheus/web.yml。
sudo nano /etc/prometheus/web.yml添加以下配置,并确保修改下面的 bcrypt 密码。
# basic_auth
basic_auth_users:
  admin: $2y$05$s8U/BrE5JhSO31XKSbtj8u8cPECULs3emEhlDfCB2GW1UefQ9x00C
完成后保存并退出文件。
现在使用 nano 打开 Prometheus 默认配置文件 /etc/prometheus/prometheus.yml。
sudo nano /etc/prometheus/prometheus.yml将 prometheus 的默认 job_name 修改为如下所示,并确保修改 basic_auth 的用户名和密码。
scrape_configs:
  # The job name is added as a label `job=<job_name>` to any timeseries scraped from this config.
  - job_name: "prometheus"

    # metrics_path defaults to '/metrics'
    # scheme defaults to 'http'.
    # add settings for certificate and authentication
    scheme: http
    basic_auth:
      username: "admin"
      password: "password"

    static_configs:
      # if using a valid certificate, set the same hostname in the certificate
      - targets: ["localhost:9090"]
保存并退出文件。
最后,运行以下命令将文件 prometheus.yml 和 web.yml 的属主改为用户 prometheus。
sudo chown prometheus: /etc/prometheus/{prometheus.yml,web.yml}将 Prometheus 作为 systemd 服务运行
使用 nano 编辑器新建 systemd 服务文件 /etc/systemd/system/prometheus.service。
sudo nano /etc/systemd/system/prometheus.service向文件中添加以下内容。这样,Prometheus 将作为 systemd 服务在后台运行,并通过 web.yml 文件保护 Web 控制台。
[Unit]
Description=Prometheus
Documentation=https://prometheus.io/docs/introduction/overview/
Wants=network-online.target
After=network-online.target

[Service]
Type=simple
User=prometheus
Group=prometheus
ExecReload=/bin/kill -HUP $MAINPID
ExecStart=/usr/local/bin/prometheus \
 --config.file=/etc/prometheus/prometheus.yml \
 --storage.tsdb.path=/var/lib/prometheus \
 --web.console.templates=/etc/prometheus/consoles \
 --web.console.libraries=/etc/prometheus/console_libraries \
 --web.listen-address=0.0.0.0:9090 \
 --web.config.file=/etc/prometheus/web.yml \

SyslogIdentifier=prometheus
Restart=always

[Install]
WantedBy=multi-user.target
保存文件并退出编辑器。
现在运行以下命令重新加载 systemd 管理器以使配置生效。
sudo systemctl daemon-reload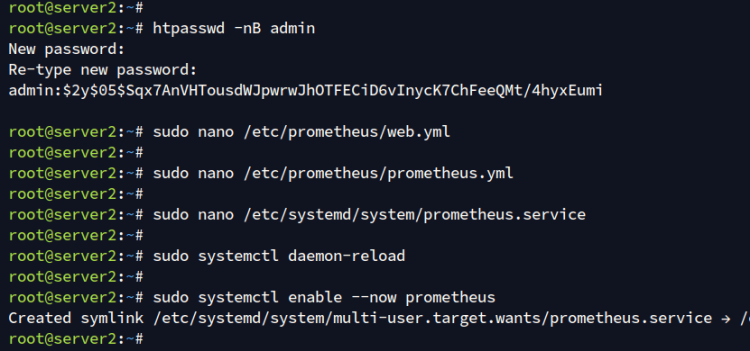
然后,使用以下 systemctl 命令启动并设置 Prometheus 服务开机自启,并确认服务正在运行。
sudo systemctl enable --now prometheus
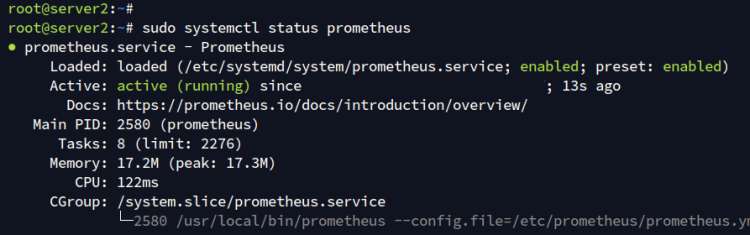
sudo systemctl status prometheus
在下面的输出中,你可以看到 prometheus 服务正在运行且已启用。
安装 node_exporter
现在 Grafana 和 Prometheus 都已运行,你将下载并安装 node_exporter。node_exporter 可让你抓取基础系统监控数据。
使用以下 curl 命令下载 node_exporter 二进制文件。
curl -s https://api.github.com/repos/prometheus/node_exporter/releases/latest| grep browser_download_url|grep linux-amd64|cut -d ‘"’ -f 4|wget -qi -下载完成后,解压 node_exporter 并进入目录。
tar -xvf node_exporter*.tar.gz cd node_exporter*/现在将 node_exporter 二进制文件复制到 /usr/local/bin 目录。
sudo cp node_exporter /usr/local/bin之后,运行以下命令为 node_exporter 新建 systemd 服务文件 /etc/systemd/system/node_exporter.service。
sudo tee /etc/systemd/system/node_exporter.service <<EOF
[Unit]
Description=Node Exporter
Wants=network-online.target
After=network-online.target
[Service]
User=prometheus
ExecStart=/usr/local/bin/node_exporter
[Install]
WantedBy=default.target
EOF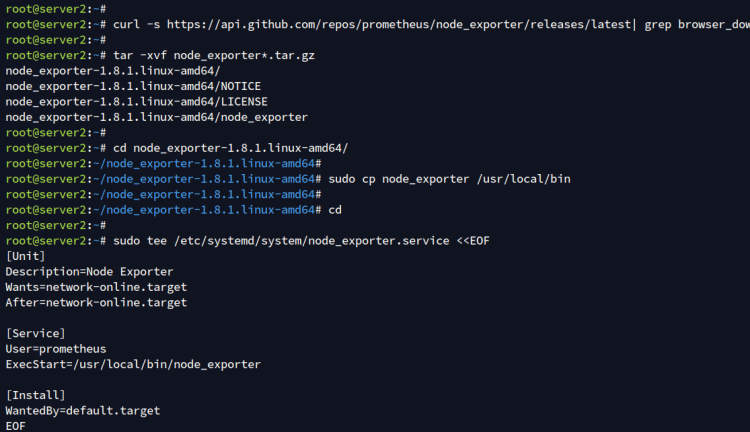
使用以下命令重新加载 systemd 管理器:
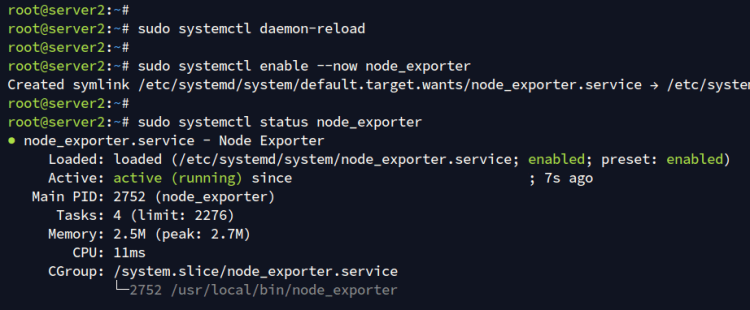
sudo systemctl daemon-reload现在你可以使用以下命令启动并设置 node_exporter 服务开机自启,然后检查 node_exporter 服务状态。
sudo systemctl enable --now node_exporter sudo systemctl status node_exporter你将看到 node_exporter 服务正在运行,并开始采集和填充数据。node_exporter 服务运行在默认端口 9100。
将 node_exporter 集成到 Prometheus
在本节中,你将把 node_exporter 集成并添加到 Prometheus。
打开 Prometheus 默认配置文件 /etc/prometheus/prometheus.yml。
sudo nano /etc/prometheus/prometheus.yml添加一个名为 node_exporter 的新 job_name,并将目标指向类似 192.168.5.16:9100 的地址。
  - job_name: "node_exporter"

    static_configs:
      - targets: ["192.168.5.100:9100"]
完成后保存并退出文件。
现在运行以下命令重启 prometheus 服务以使改动生效。
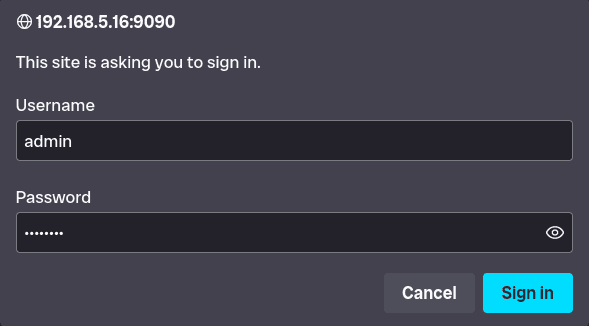
sudo systemctl restart prometheus接下来,通过浏览器访问 Prometheus 服务器 http://192.168.5.16:9090,系统将提示你进行基础认证。
输入用户名和密码,然后点击 Sign In。
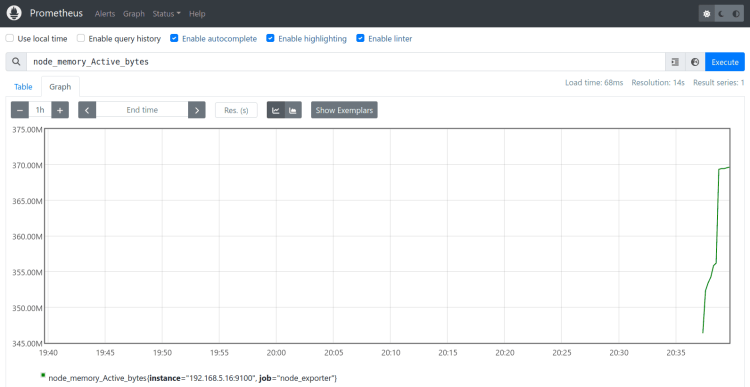
登录 Prometheus 仪表盘后,在查询框中输入 node_memory_Active_bytes 并点击 Execute。你将看到类似下图的当前活跃内存图表:
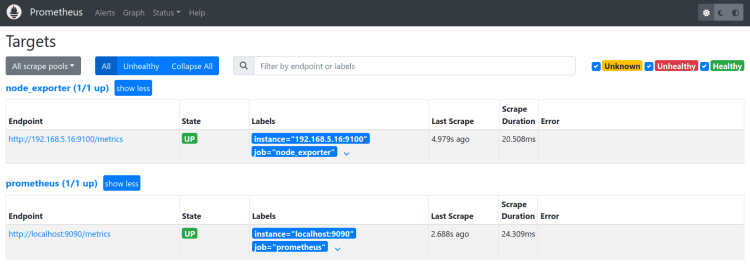
最后,点击 Status > Targets,确认 prometheus 和 node_exporter 两个目标都已激活并正在运行,如下图所示:
将 Prometheus 作为数据源集成到 Grafana
现在 Prometheus 已就绪,你将把 Prometheus 作为数据源添加并集成到 Grafana,然后创建一个新的系统监控仪表盘。
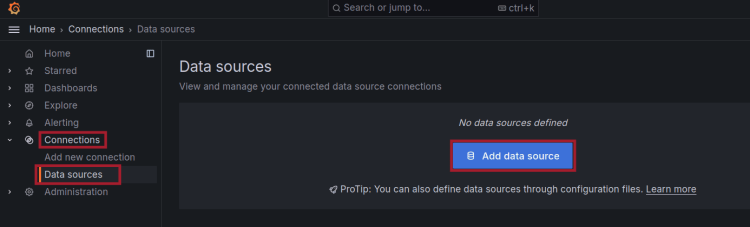
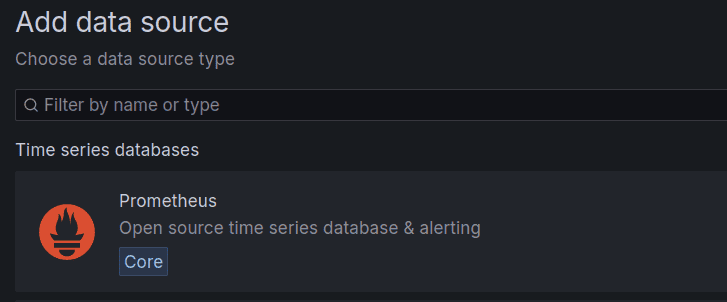
在 Grafana 仪表盘中,点击 Connections > Data Sources > Add data source,在 Grafana 中新增一个数据源。
选择 Prometheus 作为数据源。
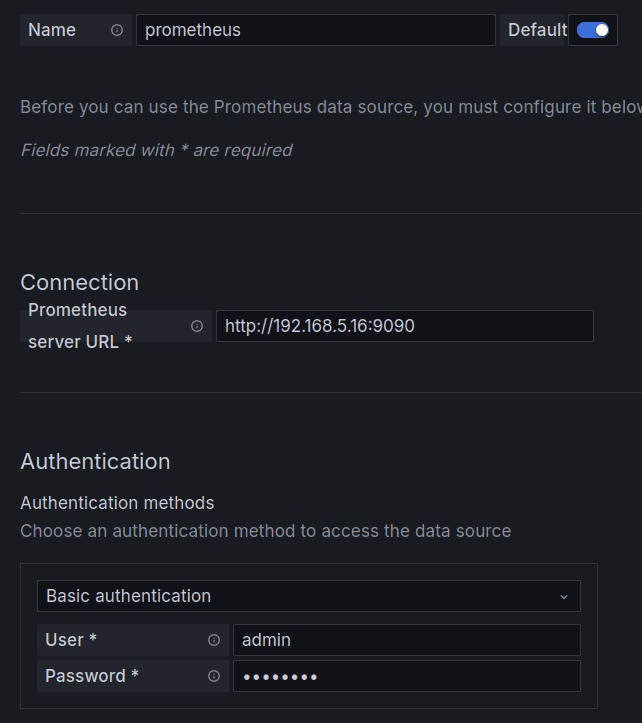
输入 Prometheus 的 URL(如 http://192.168.5.16:9090/),并填写你的 Prometheus 服务器的用户名和密码。
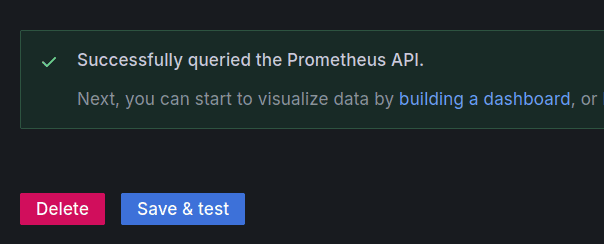
滚动到页面底部并点击 Save & test。如果成功,你将看到提示信息 Successfully queried the Prometheus API。
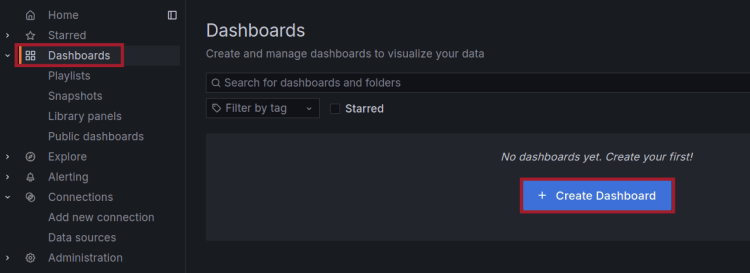
将 Prometheus 添加为数据源后,你将创建一个新的 Grafana 仪表盘用于系统监控。
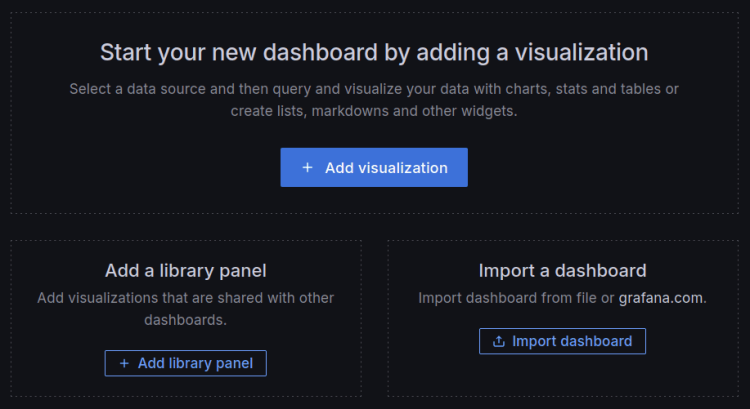
点击菜单 Dashboard > Create dashboard。
选择 Import dashboard 以导入仪表盘。
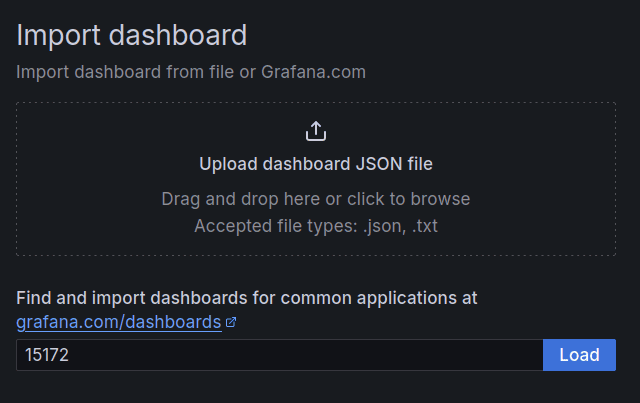
访问 https://grafana.com/grafana/dashboards/ 并找到合适的仪表盘。在本示例中,你将加载 ID 为 15172 的 Grafana 仪表盘。
点击 Load 以导入该仪表盘。
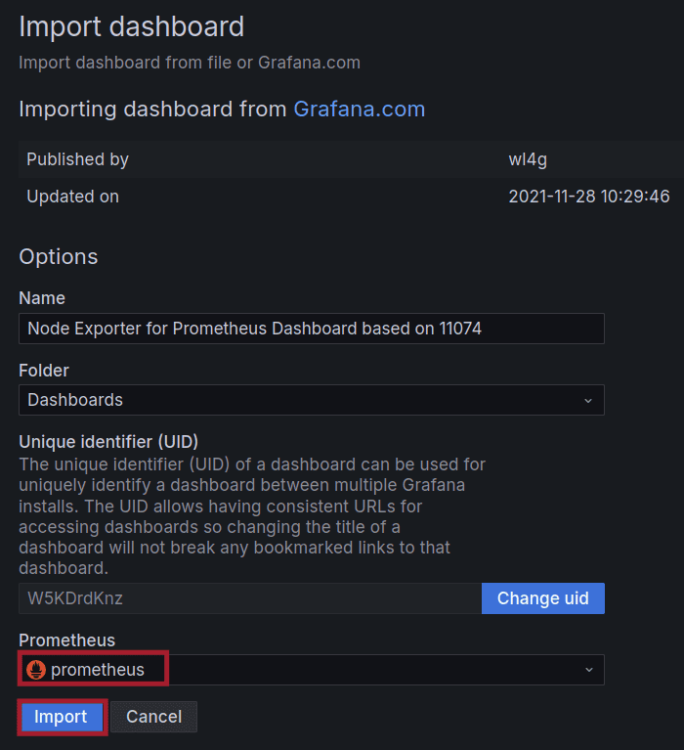
现在选择 Prometheus 作为后端,并点击 Import 确认。
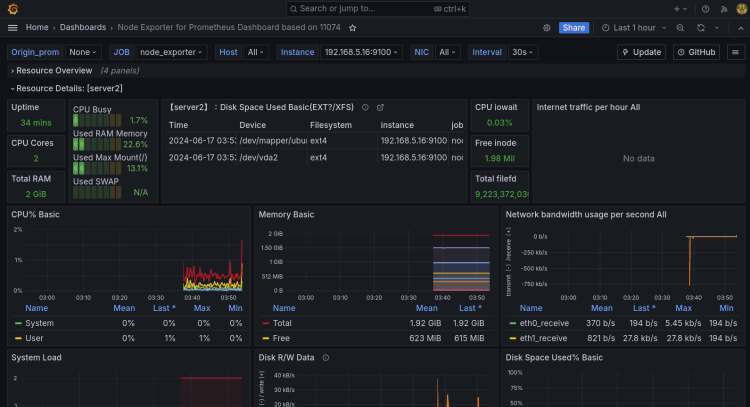
如果一切顺利,你的 Grafana 仪表盘就创建完成了。下面是集成了 Prometheus 和 node_exporter 监控的 Grafana 仪表盘截图:
总结
恭喜!你已完成了在 Ubuntu 24.04 服务器上安装 Grafana、Prometheus 和 node_exporter。你已让 Grafana 在 Nginx 反向代理下运行,使用密码认证保护了 Prometheus,将 node_exporter 与 Prometheus 集成,把 Prometheus 作为数据源添加到 Grafana,并导入了 Grafana 仪表盘。