
本页内容
- 前提条件
- 开始准备
- 安装 Grafana 8
- 安装 Nginx 作为 Grafana 的反向代理
- 访问 Grafana 仪表板
- 使用 Let's Encrypt 保护 Grafana
- 结论
Grafana 是一款免费的开源数据可视化工具,用于监控来自其他主机的指标。它使用 Typescript 和 Go 编写,允许你创建和编辑日志图表与数据图表,并创建指标。它可以从时序数据库(包括 Graphite、InfluxDB 或 OpenTSDB)生成图表和仪表板,并允许你与其他用户共享。
功能特性
- 仪表板模板
- 配置注解
- 信息亭模式和播放列表
- 自定义插件
- 告警与告警钩子
在本文中,我们将向你展示如何在 Debian 11 上安装 Grafana 8。
前提条件
- 一台运行 Debian 11 的服务器。
- 一个指向你服务器 IP 的有效域名。
- 服务器上已配置 root 密码。
开始准备
在开始之前,建议先将系统更新到最新版本。你可以使用以下命令更新所有软件包:
apt-get update -y更新完所有软件包后,使用以下命令安装其他所需的依赖项:
apt-get install gnupg2 curl wget git software-properties-common -y所有软件包安装完成后,即可进行下一步。
安装 Grafana 8
默认情况下,Debian 11 的默认仓库中不包含 Grafana。因此你需要将 Grafana 仓库添加到 APT。你可以使用以下命令添加:
curl https://packages.grafana.com/gpg.key | apt-key add -
add-apt-repository "deb https://packages.grafana.com/oss/deb stable main"
添加仓库后,使用以下命令更新仓库缓存并安装 Grafana:
apt-get update -y
apt-get install grafana -y
Grafana 安装完成后,使用以下命令启动并启用 Grafana 服务:
systemctl start grafana-server
systemctl enable grafana-server
你也可以使用以下命令查看 Grafana 服务的状态:
systemctl status grafana-server你将看到以下输出:
? grafana-server.service - Grafana instance
     Loaded: loaded (/lib/systemd/system/grafana-server.service; disabled; vendor preset: enabled)
     Active: active (running) since Fri 2022-02-04 04:08:25 UTC; 5s ago
       Docs: http://docs.grafana.org
   Main PID: 8602 (grafana-server)
      Tasks: 9 (limit: 2341)
     Memory: 29.6M
        CPU: 1.299s
     CGroup: /system.slice/grafana-server.service
             ??8602 /usr/sbin/grafana-server --config=/etc/grafana/grafana.ini --pidfile=/run/grafana/grafana-server.pid --packaging=deb cfg:>

Feb 04 04:08:27 debian11 grafana-server[8602]: t=2022-02-04T04:08:27+0000 lvl=info msg="migrations completed" logger=migrator performed=381 s>
Feb 04 04:08:27 debian11 grafana-server[8602]: t=2022-02-04T04:08:27+0000 lvl=info msg="Created default admin" logger=sqlstore user=admin
Feb 04 04:08:27 debian11 grafana-server[8602]: t=2022-02-04T04:08:27+0000 lvl=info msg="Created default organization" logger=sqlstore
Feb 04 04:08:27 debian11 grafana-server[8602]: t=2022-02-04T04:08:27+0000 lvl=info msg="Initialising plugins" logger=plugin.manager
Feb 04 04:08:27 debian11 grafana-server[8602]: t=2022-02-04T04:08:27+0000 lvl=info msg="Plugin registered" logger=plugin.manager pluginId=inp>
Feb 04 04:08:27 debian11 grafana-server[8602]: t=2022-02-04T04:08:27+0000 lvl=info msg="Live Push Gateway initialization" logger=live.push_ht>
Feb 04 04:08:27 debian11 grafana-server[8602]: t=2022-02-04T04:08:27+0000 lvl=info msg="Writing PID file" logger=server path=/run/grafana/gra>
Feb 04 04:08:27 debian11 grafana-server[8602]: t=2022-02-04T04:08:27+0000 lvl=info msg="HTTP Server Listen" logger=http.server address=[::]:3>
Feb 04 04:08:27 debian11 grafana-server[8602]: t=2022-02-04T04:08:27+0000 lvl=info msg="warming cache for startup" logger=ngalert
Feb 04 04:08:27 debian11 grafana-server[8602]: t=2022-02-04T04:08:27+0000 lvl=info msg="starting MultiOrg Alertmanager" logger=ngalert.multio>
默认情况下,Grafana 监听 3000 端口。你可以使用以下命令查看:
ss -antpl | grep 3000你将看到以下输出:
LISTEN 0 4096 *:3000 *:* users:(("grafana-server",pid=8602,fd=8))
安装 Nginx 作为 Grafana 的反向代理
接下来,你需要安装并配置 Nginx 作为 Grafana 的反向代理。首先,使用以下命令安装 Nginx:
apt-get install nginx -yNginx 安装完成后,使用以下命令创建 Nginx 虚拟主机配置文件:
nano /etc/nginx/conf.d/grafana.conf添加以下内容:
server {
        server_name grafana.example.com;
        listen 80;
        access_log /var/log/nginx/grafana.log;


        location / {
                proxy_pass http://localhost:3000;
                proxy_set_header X-Forwarded-Host $host:$server_port;
                proxy_set_header X-Forwarded-Server $host;
                proxy_set_header X-Forwarded-For $proxy_add_x_forwarded_for;
        }
}
完成后保存并关闭文件。然后,使用以下命令检查 Nginx 是否存在语法错误:
nginx -t如果一切正常,你将看到以下输出:
nginx: the configuration file /etc/nginx/nginx.conf syntax is ok
nginx: configuration file /etc/nginx/nginx.conf test is successful
接下来,重启 Nginx 以应用配置更改。
systemctl restart nginx你也可以使用以下命令查看 Nginx 的状态:
systemctl status nginx你将看到以下输出:
? nginx.service - A high performance web server and a reverse proxy server
     Loaded: loaded (/lib/systemd/system/nginx.service; enabled; vendor preset: enabled)
     Active: active (running) since Fri 2022-02-04 04:09:20 UTC; 4s ago
       Docs: man:nginx(8)
    Process: 8631 ExecStartPre=/usr/sbin/nginx -t -q -g daemon on; master_process on; (code=exited, status=0/SUCCESS)
    Process: 8632 ExecStart=/usr/sbin/nginx -g daemon on; master_process on; (code=exited, status=0/SUCCESS)
   Main PID: 8633 (nginx)
      Tasks: 2 (limit: 2341)
     Memory: 2.5M
        CPU: 35ms
     CGroup: /system.slice/nginx.service
             ??8633 nginx: master process /usr/sbin/nginx -g daemon on; master_process on;
             ??8634 nginx: worker process

Feb 04 04:09:20 debian11 systemd[1]: Starting A high performance web server and a reverse proxy server...
Feb 04 04:09:20 debian11 systemd[1]: nginx.service: Failed to parse PID from file /run/nginx.pid: Invalid argument
Feb 04 04:09:20 debian11 systemd[1]: Started A high performance web server and a reverse proxy server.
至此,Nginx 已安装并配置为 Grafana 的反向代理。现在可以进行下一步。
访问 Grafana 仪表板
现在,打开 Web 浏览器,使用 URL http://grafana.example.com 访问 Grafana Web 界面。你将被重定向到 Grafana 登录页面:
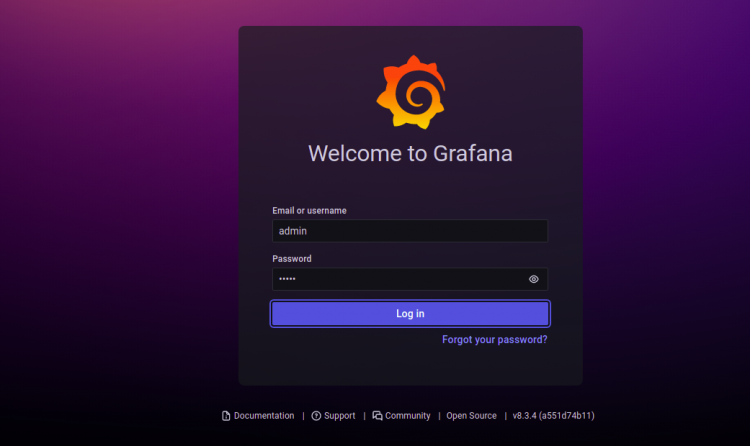
输入管理员用户名和密码,然后点击 Log in 按钮。你应该会看到 Grafana 密码重置界面:
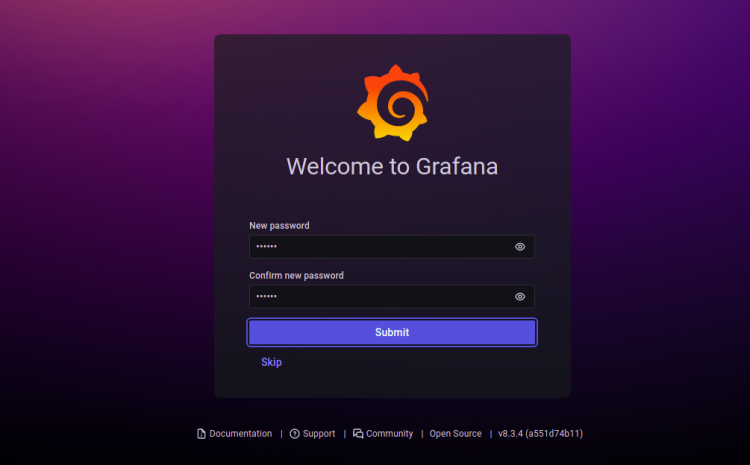
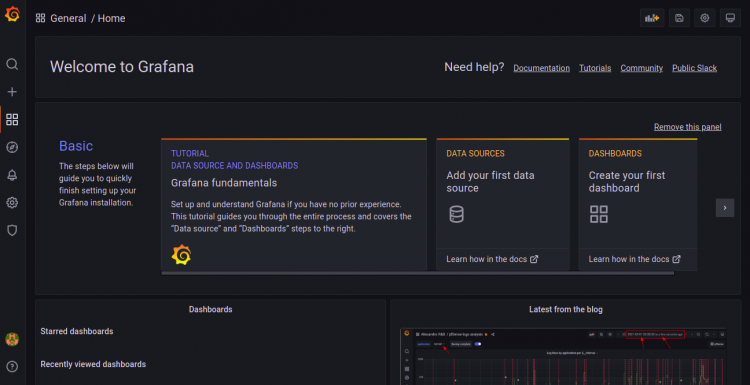
设置新密码并点击 Submit 按钮。你应该会在接下来的界面看到 Grafana 仪表板:
使用 Let's Encrypt 保护 Grafana
接下来,你需要安装 Certbot 客户端软件包来安装和管理 Let's Encrypt SSL。
首先,使用以下命令安装 Certbot:
apt-get install certbot python3-certbot-nginx -y安装完成后,运行以下命令为你的网站安装 Let's Encrypt SSL:
certbot --nginx -d grafana.example.com系统将要求你提供有效的电子邮件地址并接受服务条款,如下所示:
Saving debug log to /var/log/letsencrypt/letsencrypt.log
Plugins selected: Authenticator nginx, Installer nginx
Enter email address (used for urgent renewal and security notices) (Enter 'c' to
cancel):
[email protected]


- - - - - - - - - - - - - - - - - - - - - - - - - - - - - - - - - - - - - - - -
Please read the Terms of Service at
https://letsencrypt.org/documents/LE-SA-v1.2-November-15-2017.pdf. You must
agree in order to register with the ACME server at
https://acme-v02.api.letsencrypt.org/directory
- - - - - - - - - - - - - - - - - - - - - - - - - - - - - - - - - - - - - - - -
(A)gree/(C)ancel: A

- - - - - - - - - - - - - - - - - - - - - - - - - - - - - - - - - - - - - - - -
Would you be willing to share your email address with the Electronic Frontier
Foundation, a founding partner of the Let's Encrypt project and the non-profit
organization that develops Certbot? We'd like to send you email about our work
encrypting the web, EFF news, campaigns, and ways to support digital freedom.
- - - - - - - - - - - - - - - - - - - - - - - - - - - - - - - - - - - - - - - -
(Y)es/(N)o: Y
Obtaining a new certificate
Performing the following challenges:
http-01 challenge for grafana.example.com
Waiting for verification...
Cleaning up challenges
Deploying Certificate to VirtualHost /etc/nginx/conf.d/grafana.conf
接下来,选择是否将 HTTP 流量重定向到 HTTPS,如下所示:
- - - - - - - - - - - - - - - - - - - - - - - - - - - - - - - - - - - - - - - -
1: No redirect - Make no further changes to the webserver configuration.
2: Redirect - Make all requests redirect to secure HTTPS access. Choose this for
new sites, or if you're confident your site works on HTTPS. You can undo this
change by editing your web server's configuration.
- - - - - - - - - - - - - - - - - - - - - - - - - - - - - - - - - - - - - - - -
Select the appropriate number [1-2] then [enter] (press 'c' to cancel): 2
输入 2 并按 Enter 完成安装。你应该会看到以下输出:
Redirecting all traffic on port 80 to ssl in /etc/nginx/conf.d/grafana.conf

- - - - - - - - - - - - - - - - - - - - - - - - - - - - - - - - - - - - - - - -
Congratulations! You have successfully enabled https://grafana.example.com

You should test your configuration at:
https://www.ssllabs.com/ssltest/analyze.html?d=grafana.example.com
- - - - - - - - - - - - - - - - - - - - - - - - - - - - - - - - - - - - - - - -

IMPORTANT NOTES:
 - Congratulations! Your certificate and chain have been saved at:
   /etc/letsencrypt/live/grafana.example.com/fullchain.pem
   Your key file has been saved at:
   /etc/letsencrypt/live/grafana.example.com/privkey.pem
   Your cert will expire on 2022-05-07. To obtain a new or tweaked
   version of this certificate in the future, simply run certbot again
   with the "certonly" option. To non-interactively renew *all* of
   your certificates, run "certbot renew"
 - Your account credentials have been saved in your Certbot
   configuration directory at /etc/letsencrypt. You should make a
   secure backup of this folder now. This configuration directory will
   also contain certificates and private keys obtained by Certbot so
   making regular backups of this folder is ideal.
 - If you like Certbot, please consider supporting our work by:

   Donating to ISRG / Let's Encrypt:   https://letsencrypt.org/donate
   Donating to EFF:                    https://eff.org/donate-le

 - We were unable to subscribe you the EFF mailing list because your
   e-mail address appears to be invalid. You can try again later by
   visiting https://act.eff.org.
结论
恭喜!你已在 Debian 11 上成功安装了带有 Nginx 和 Let's Encrypt SSL 的 Grafana 8。现在你可以添加远程主机,并从 Grafana 仪表板开始监控它们。如有任何问题,欢迎随时向我提问。